British drivers are paying hundreds of millions of pounds in speeding fines, while many local authorities are lowering urban speed limits to 20mph.
Transport Minister Heidi Alexander has echoed predecessor Louise Haigh in saying that local highway authorities should take the lead on deciding restrictions in their own areas.
The 20mph limits have faced opposition in some quarters, with some councils in Wales – where the restrictions were first introduced – reintroducing 30mph limits on certain roads.
However, many campaigners continue to advocate for what they claim could be a life-saving speed limit reduction in Britain’s towns and cities.
To gain a true understanding into the levels of speeding on Britain’s roads, Legal Expert set out to investigate.
How Legal Expert Can Help You After A Car Accident
If you’ve been injured in a car accident that was caused by another motorist speeding or driving dangerously, we can help. Our team of specialist road traffic accident solicitors here at Legal Expert has the expertise and experience to help you if you want to claim compensation.
You can get in touch for free today or you can head here to learn more about car accident claims.
How We Conducted Our Research Into Speeding Fines
We sent Freedom of Information (FOI) requests to every police force in England and Wales asking for the number of speeding fines issued in the last three years [between April 6 – April 5 2021/22, 2022/23, 2023/24 and 2024/25].
We also ask for the roads in each policing area where the most speeding fines have been issued as the methods used for capturing the speeding offences.
Background
According to Government guidelines, the minimum penalty for speeding is £100 fine and three penalty points added to a driver’s licence. Motorists who receive 12 or more points within three years can be disqualified from driving.
Within two weeks of a vehicle being caught speeding, the registered keeper will be send a ‘Notice of Intended Prosecution,’ issued by the police informing a driver they intend to prosecute for a motoring offence, and a ‘Section 172 Notice’, a legal requirement of a registered vehicle keeper to provide details regarding the alleged traffic offence.
Failure or refusal to pay the Fixed Penalty Notice (FPN) can lead to a court appearance. If a court finds a driver guilty of speeding, they can be made to pay up to £1,000, or £2,500 maximum if they were driving on the motorway.
Legal Expert has a team of experienced solicitors at hand for anyone who has suffered as a result of a dangerous or speeding driver.
Results
Avon & Somerset Constabulary
No. of speeding fines issued
2021/22 | 183,743
2022/23 | 151,342
2023/24 | 151,495
Total | 486,580
Bedfordshire Police
No. of speeding fines issued
2021/22 | 66,177
2022/23 | 53,781
2023/24 | 55,936
Total | 175,894
20 roads in Bedfordshire where drivers have been caught speeding (2023/24)
| Location | Number of NIPs issued (Note of Intended Prosecution) |
| A1081 Airport Way, South West bound, Luton | 8073 |
| A5, Watling Street, nr Alisons Brook, Hockliffe (Both directions) | 5741 |
| Leighton Street, South West of jct with Timber Ln. Bi-directional, Woburn | 5310 |
| A1081 Airport Way, North East bound, Luton | 4338 |
| M1 Motorway, between Jnc 10 & 11 Northbound | 3480 |
| M1 Motorway, between Jnc 11 & 10 Southbound | 3230 |
| A5, Watling Street, nr Birch’s Close, Hockliffe (Both directions) | 2793 |
| A1 Southbound, Beeston | 2167 |
| A505 Dunstable Road W/B, btwn the M1 jnc 11 and Poynters Road, Luton | 2076 |
| Woburn Road, Btwn Abbott Crescent & Wolseley Road (Southbound), Kempston | 1575 |
| Bedford Road (Eastbound), btwn Willington Rd & Station Rd, Willington | 1426 |
| A603 Bedford Road, near j/w Dynes Place, Bi-directional, Moggerhanger | 1371 |
| A1 Northbound, Beeston | 1049 |
| M1 Motorway, between Jnc 13 & 12 Southbound | 959 |
| Hitchin Road, At jct with South Entrance to The Green. Bi-directional, Upper Caldecote | 803 |
| Park Viaduct, Luton | 794 |
| Farley Hill, (Bi-directional), Luton | 768 |
| Sundon Park Road, outside Lealands School (Bi-directional), Luton | 706 |
| Bedford Road (Westbound), btwn Willington Rd & Station Rd. Willington | 675 |
| Woburn Road, Btwn Wolseley Road & Abbott Crescent (Northbound), Kempston | 644 |
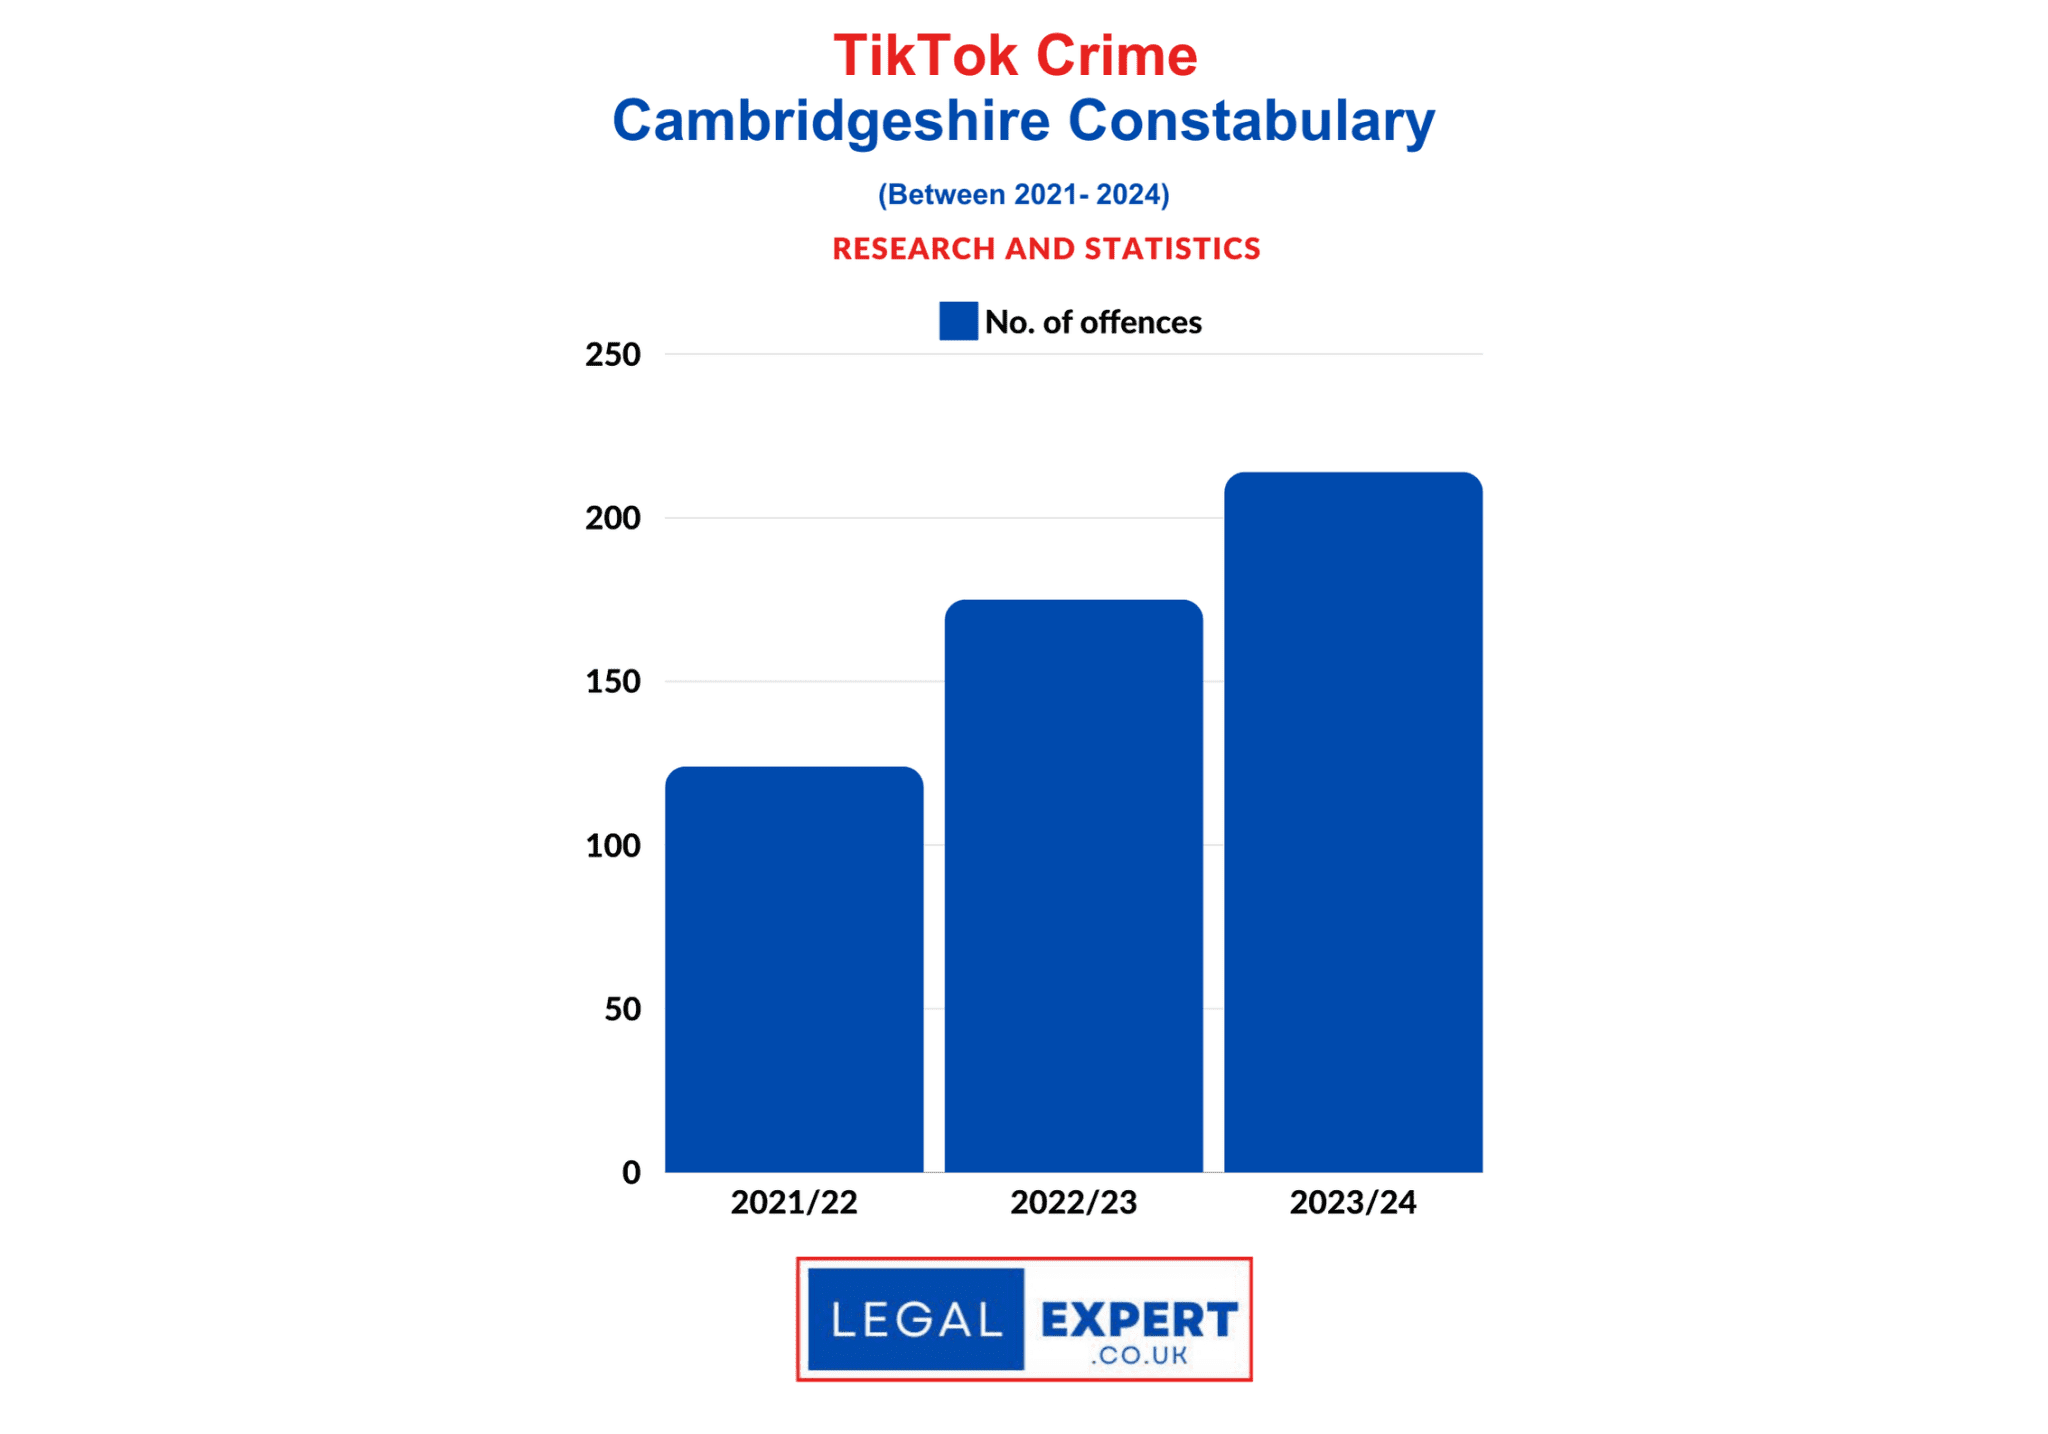
Cambridgeshire Constabulary
No. of speeding fines issued
2021/22 | 38,147
2022/23 | 33,775
2023/24 | 36,210
Total | 108,132
20 roads in Cambridgeshire where drivers have been caught speeding (2023/24)
| Location | Number of NIPs issued (Note of Intended Prosecution) |
| A14, W/B MP 0829B, Fenstanton | 4353 |
| A14, W/B MP 0772B, Offord Cluny | 3761 |
| A1139 Fletton Parkway, Eastbound, Peterborough | 3347 |
| A1, S/B MP 2043B, Alconbury | 3052 |
| A14 Eastbound, Bythorn | 2958 |
| A1, Gt North Road, Northbound (Roadworks), Water Newton | 2574 |
| A1134 Elizabeth Way, southbound, Cambridge | 1690 |
| A14, W/B MP 0727B, Buckden | 1527 |
| A1, Gt North Road, Southbound (Roadworks), Alwalton | 1258 |
| A605 Eastbound, between Elton and jnc with A1 | 969 |
| A14, E/B MP 0917A, Bar Hill | 954 |
| A605 Westbound, between jnc with A1 and Elton | 930 |
| A15 Bourges Boulevard, Peterborough | 898 |
| A1 Great North Road (Southbound), Buckden | 635 |
| A1307, near Horseheath Green, Westbound, Horseheath | 605 |
| A1307, near Horseheath Green, Eastbound, Horseheath | 528 |
| A1134 Barnwell Road, o/s 113, Cambridge | 398 |
| A1 Great North Road (Northbound), Buckden | 367 |
| A603 Barton Road, Cambridge | 339 |
| A1307 Eastbound, (Low Road Flyover), Stukeley | 302 |
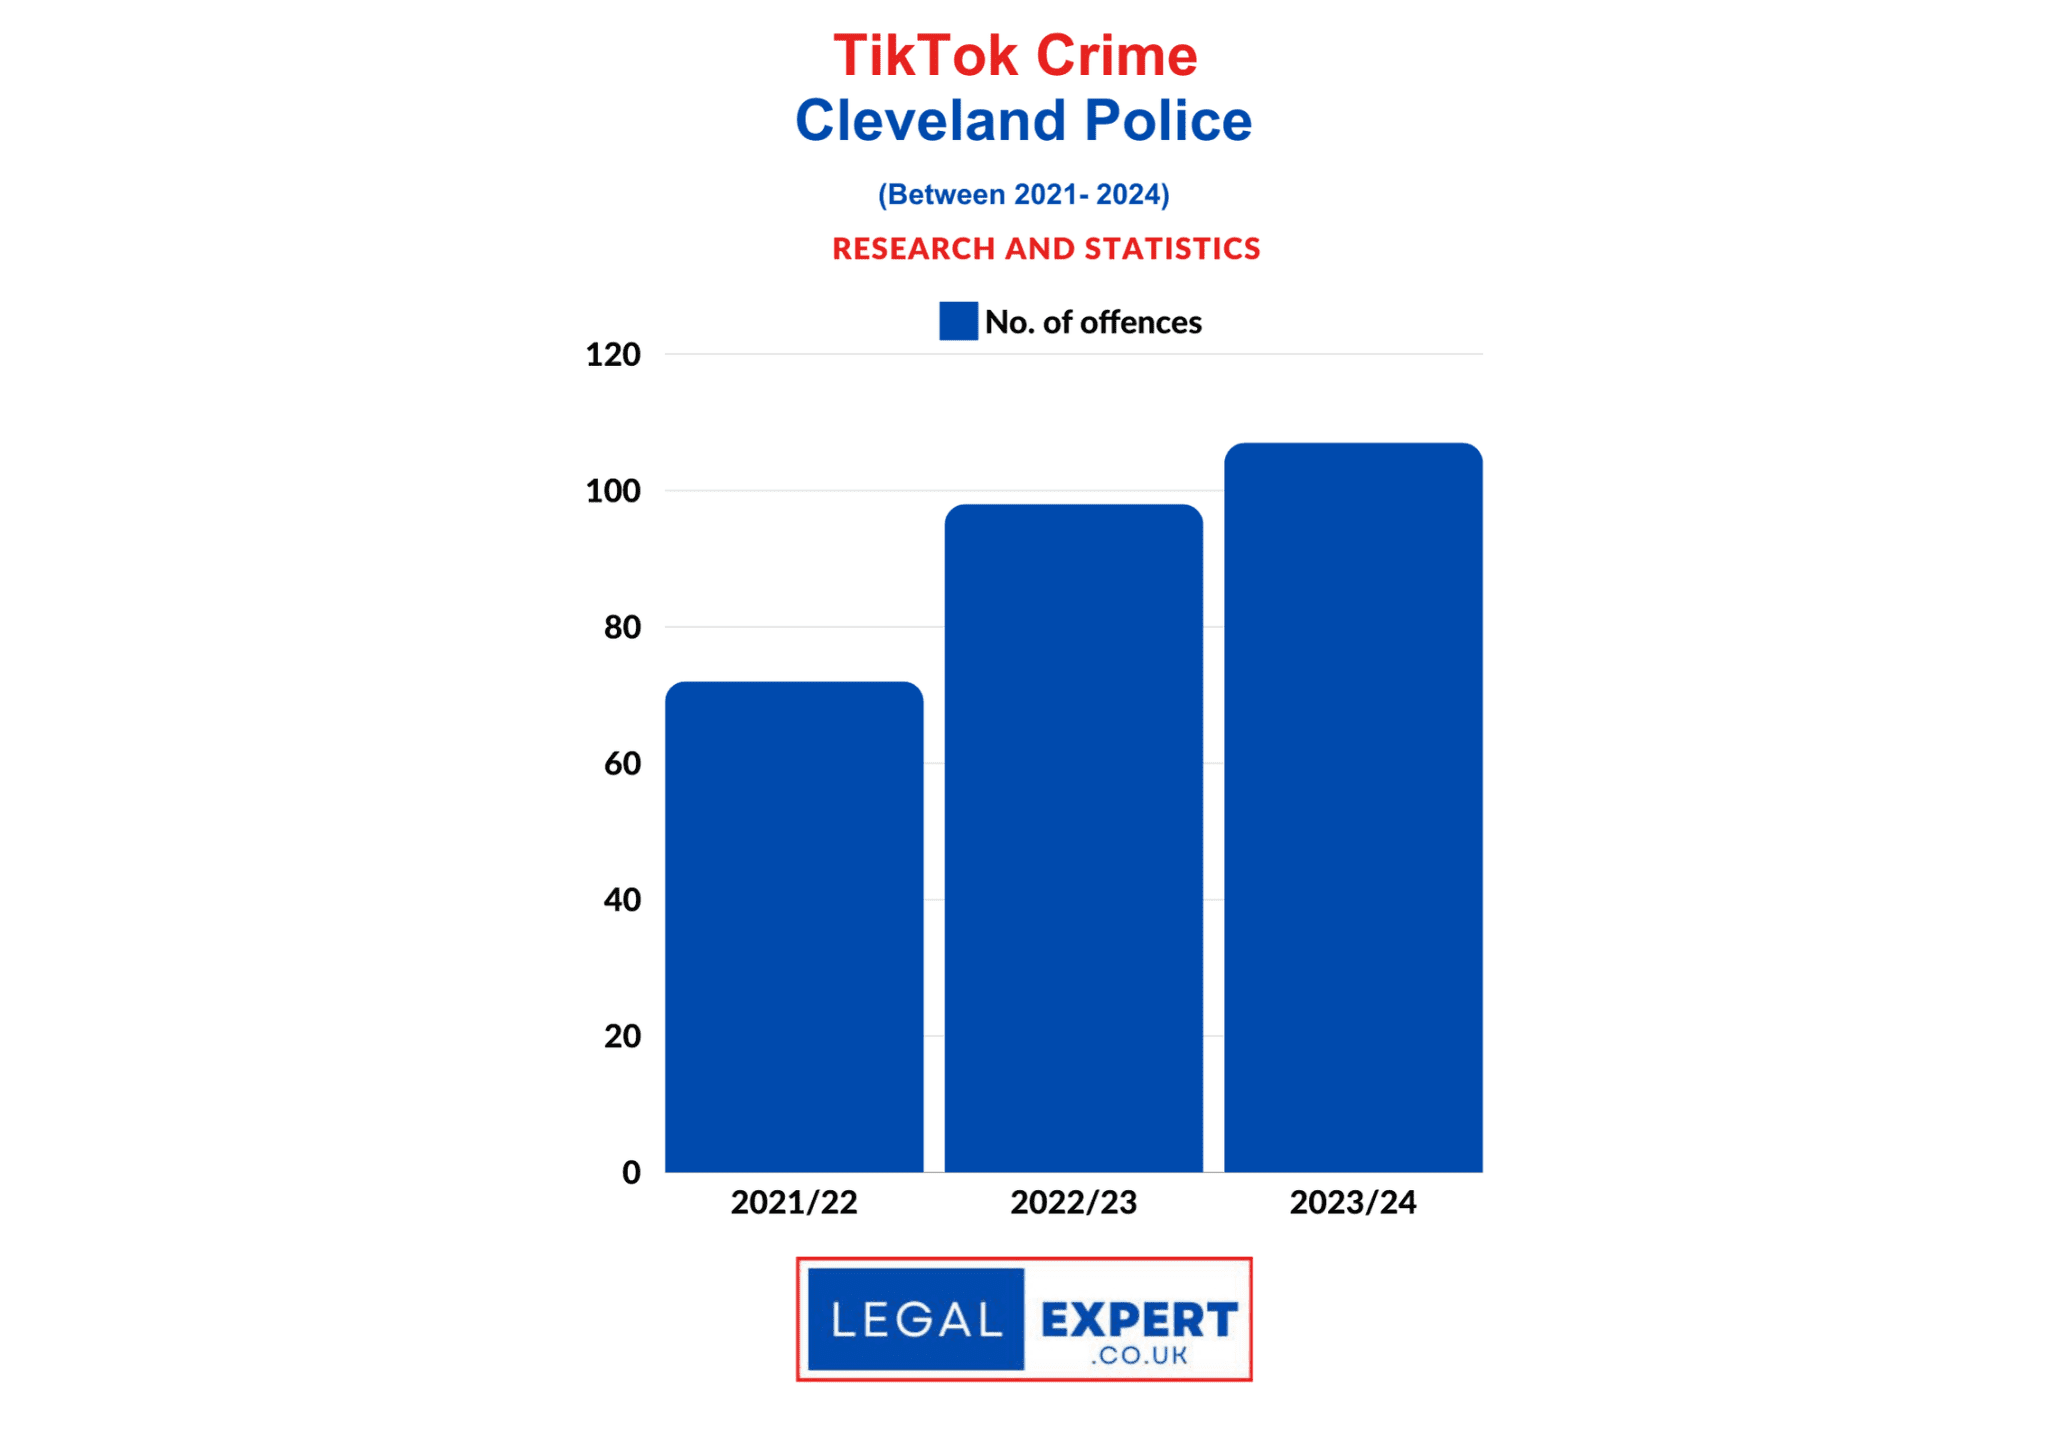
Cleveland Police
No. of speeding fines issued
2021/22 | 15,629
2022/23 | 9,017
2023/24 | 10,726
Total | 35,372
20 roads in Cleveland policing area where drivers have been caught speeding (2023/24)
Location | No. of People Exceeding Speed Limit
-
A66 (W) Whinney Banks, Middlesbrough | 428
-
A174 (Lazenby Bypass), Redcar | 386
-
Queen Elizabeth Way, Stockton | 373
-
Plantation Road, Redcar | 350
-
B1365, Middlesbrough | 317
-
Powlett Road, Hartlepool | 300
-
Wolviston Road, Billingham | 289
-
A66 (W) Teesside Park, Stockton | 284
-
A66 (E) Surtees Bridge, Stockton | 282
-
Myton Way, Ingleby Barwick | 278
-
Park Road North, Middlesbrough | 267
-
Trimdon Avenue, Middlesbrough | 242
-
Mitchell Avenue, Stockton | 237
-
B1380, Eston | 228
-
West View Road, Hartlepool | 224
-
Hall Drive, Acklam | 202
-
Belle Vue Way, Hartlepool | 194
-
Oxbridge Avenue, Stockton | 190
-
Park Vale Road, Middlesbrough | 181
-
Middlesbrough Road, Guisborough | 174
Cumbria Constabulary
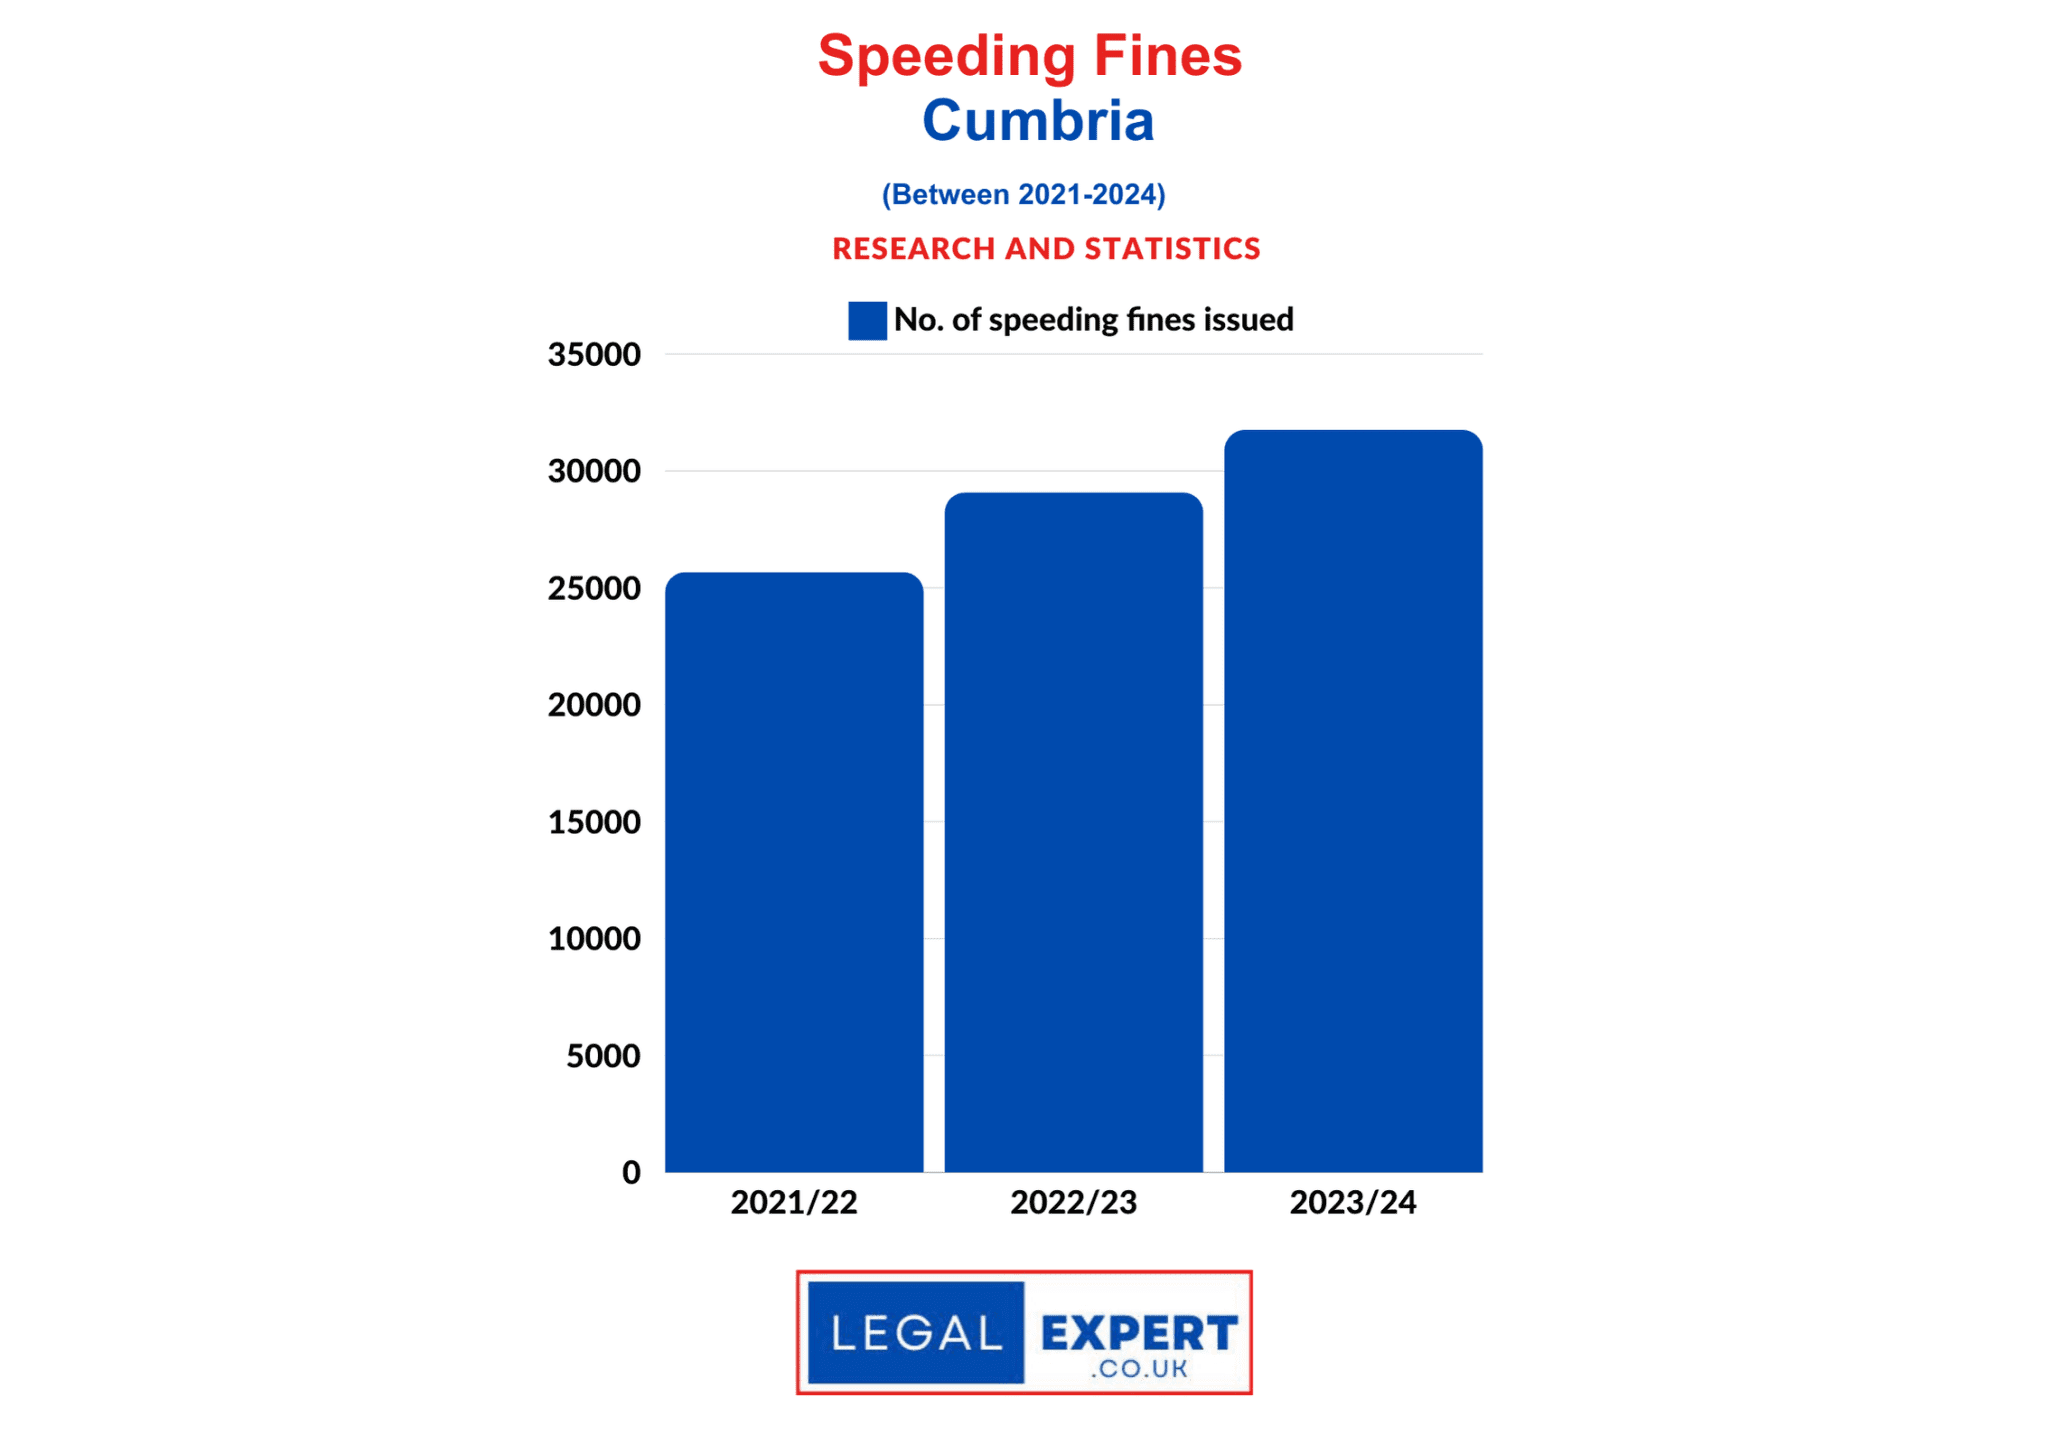
Speeding Offences – Cumbria
No. of speeding fines issued
2021/22 | 25,672
2022/23 | 29,088
2023/24 | 31,759
Total | 86,519
20 roads in Cumbria where drivers have been caught speeding (2023/24)
Location | No. of People Exceeding Speed Limit
- A591 Ings travelling East (EF6) | 3133
- A66 Kirkby Thore travelling West | 2367
- A66 Kirkby Thore travelling East | 1456
- A591 Ings travelling West (WF5) | 1360
- A590 Millside travelling East | 1045
- A7 Longtown travelling South | 653
- Warwick Bridge/Corby Hill W/B | 539
- A65 Kirkby Lonsdale travelling West | 531
- Warwick Bridge/Corby Hill E/B | 497
- A66 Temple Sowerby Bypass | 409
- A66 Temple Sowerby Bypass | 404
- A69 Low Row travelling West | 376
- M6 Capplerigg | 356
- M6 Floriston | 356
- A6 Shap Road, Kendal Rugby Club | 334
- M6 Brunthwaite | 329
- A6 Shap Road, Kendal Rugby Club | 306
- M6 Plumpton overbridge | 272
- A596 Wigton By-pass travelling West | 252
- A66 Troutbeck/Mungrisedale R/Ends | 247
Durham Constabulary
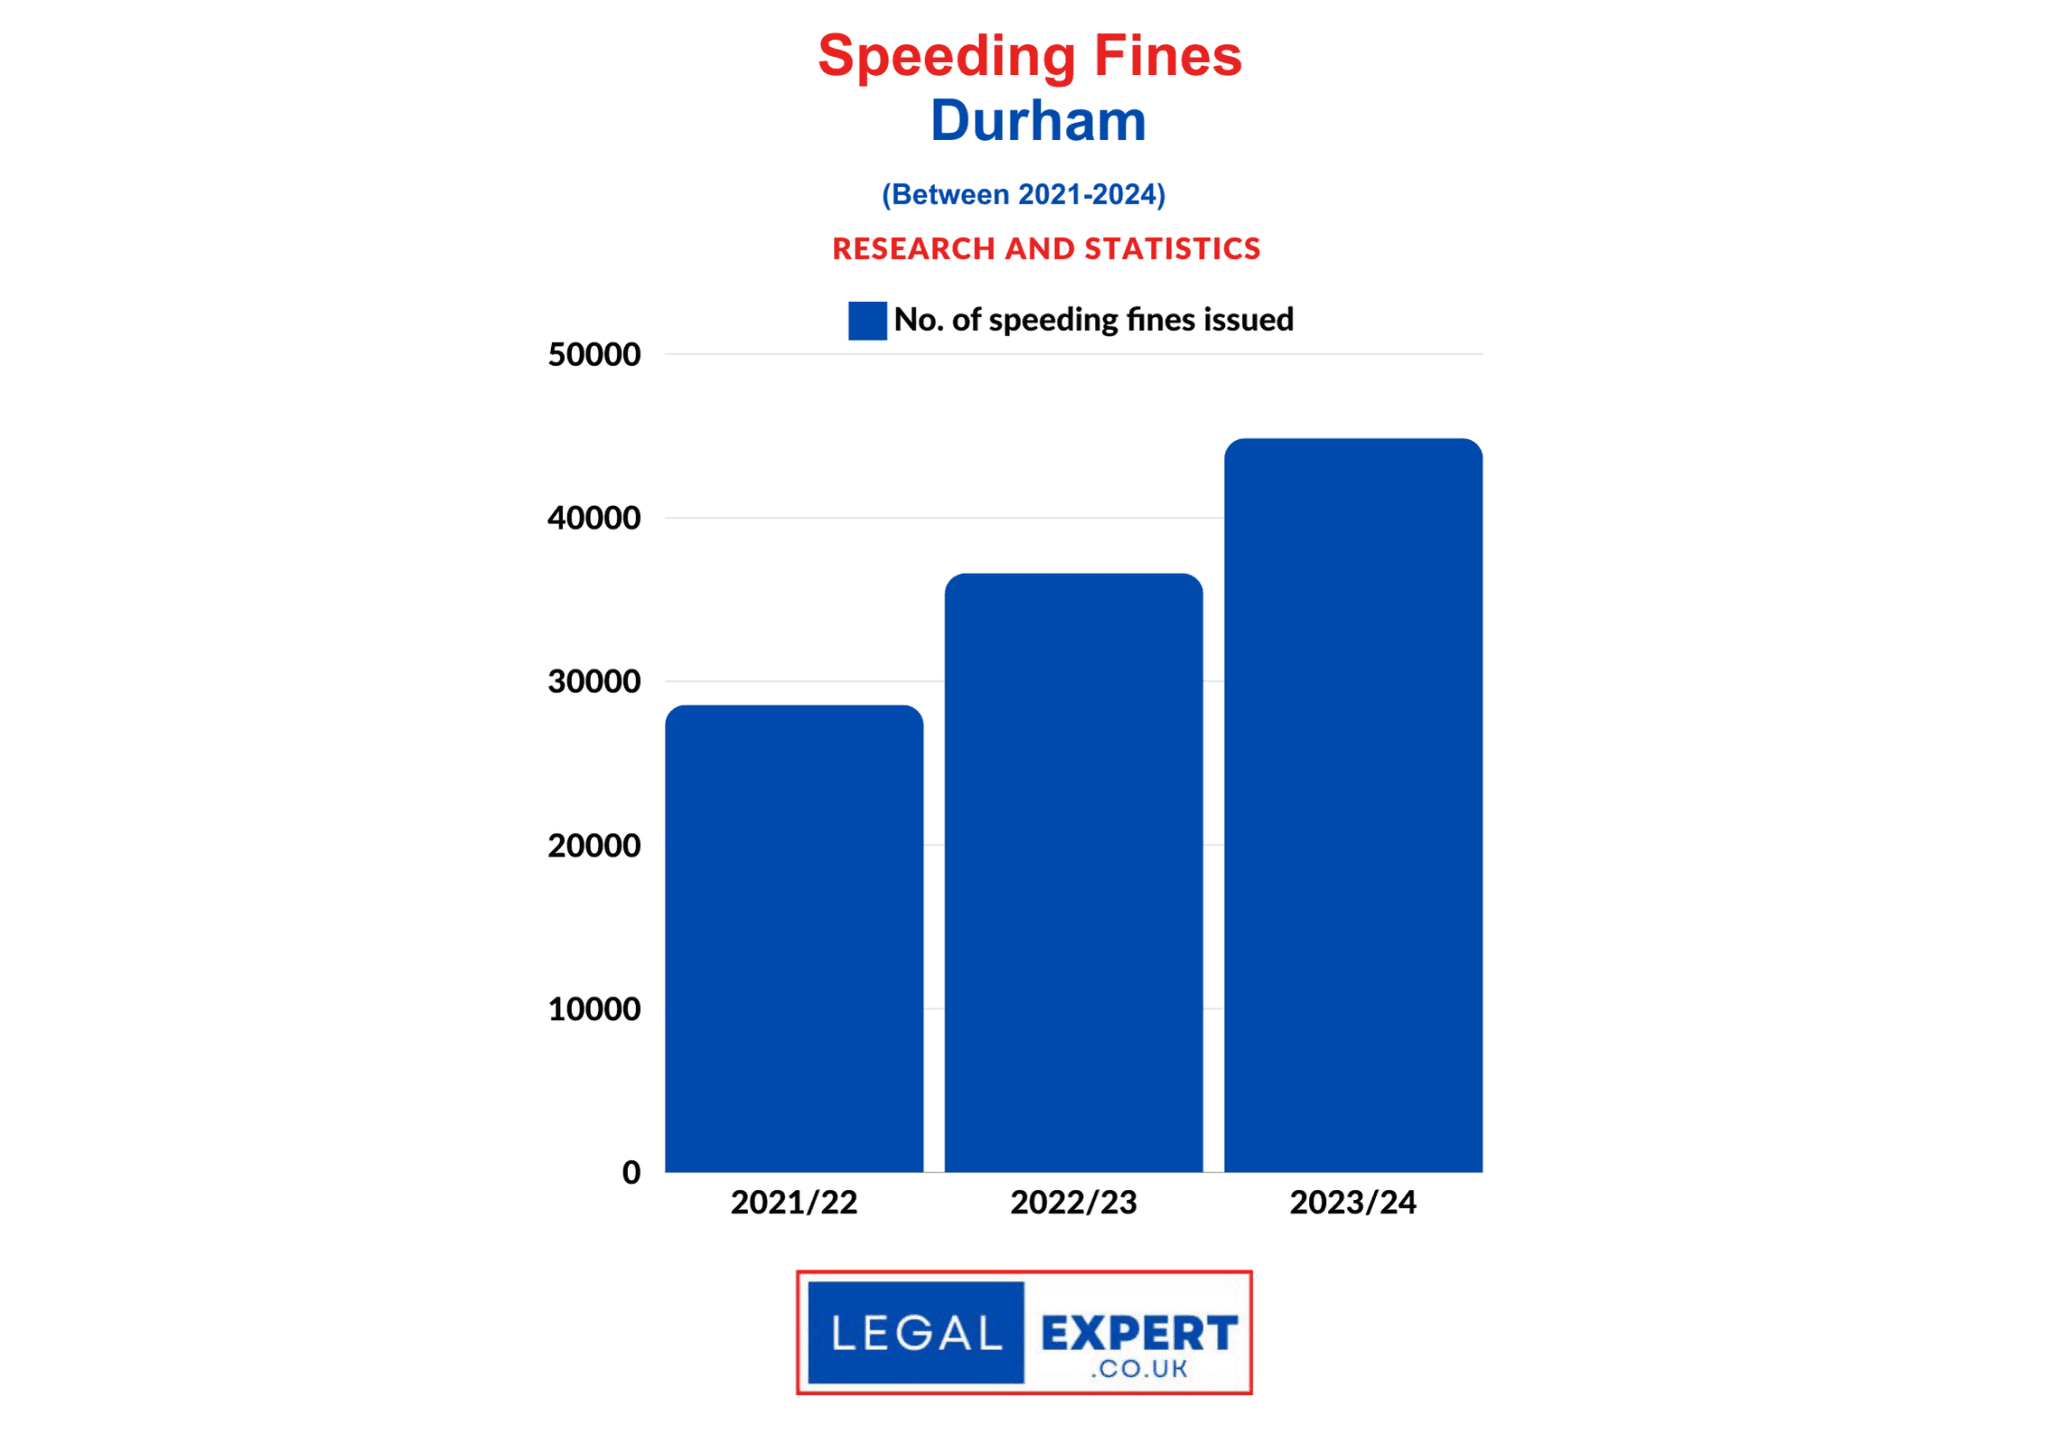
Speeding Offences – Durham
No. of speeding fines issued
2021/22 | 28,566
2022/23 | 36,599
2023/24 | 44,863
Total | 110,028
20 roads in Cumbria where drivers have been caught speeding (2023/24)
Location | No. of People Exceeding Speed Limit
- A1(M) J61 Bowburn to J60 Bradbury, Durham (Police Ramp H/S) | 5906
- B1283, Hall Walks, Easington Village | 2226
- A68, High Etherley | 2066
- A1(M) J59 Aycliffe to J60 Bradbury, Durham (Police Ramp H/S) | 1917
- B6288 North Road, Spennymoor | 1900
- A693 Blind Lane, Chester le Street| 1850
- B1278 Salters Lane – Lillie Terrace, Trimdon Grange | 1293
- A1(M) J61 Bowburn to J62 Carrville, Durham (Police Ramp H/S) | 1264
- B6309 Watling Street, Leadgate | 1257
- A66 Galley Bank, Barnard Castle | 1254
- A692 Dipton (Nr. B6311 Flint Hill Bank) | 1107
- C151, Stockton Road, Easington Village | 1016
- C10 Fair View, Burnhope | 986
- A690 West Rainton, Durham | 899
- A167 Hermitage to Plawsworth, Chester-le-Street | 775
- Burtree Lane, Darlington | 746
- B1284 Lumley New Road, Woodstone Village | 729
- B6308 Medomsley Road, Consett | 688
- A68 Fir Tree, Crook | 675
- A67 Darlington Road, Barnard Castle | 665
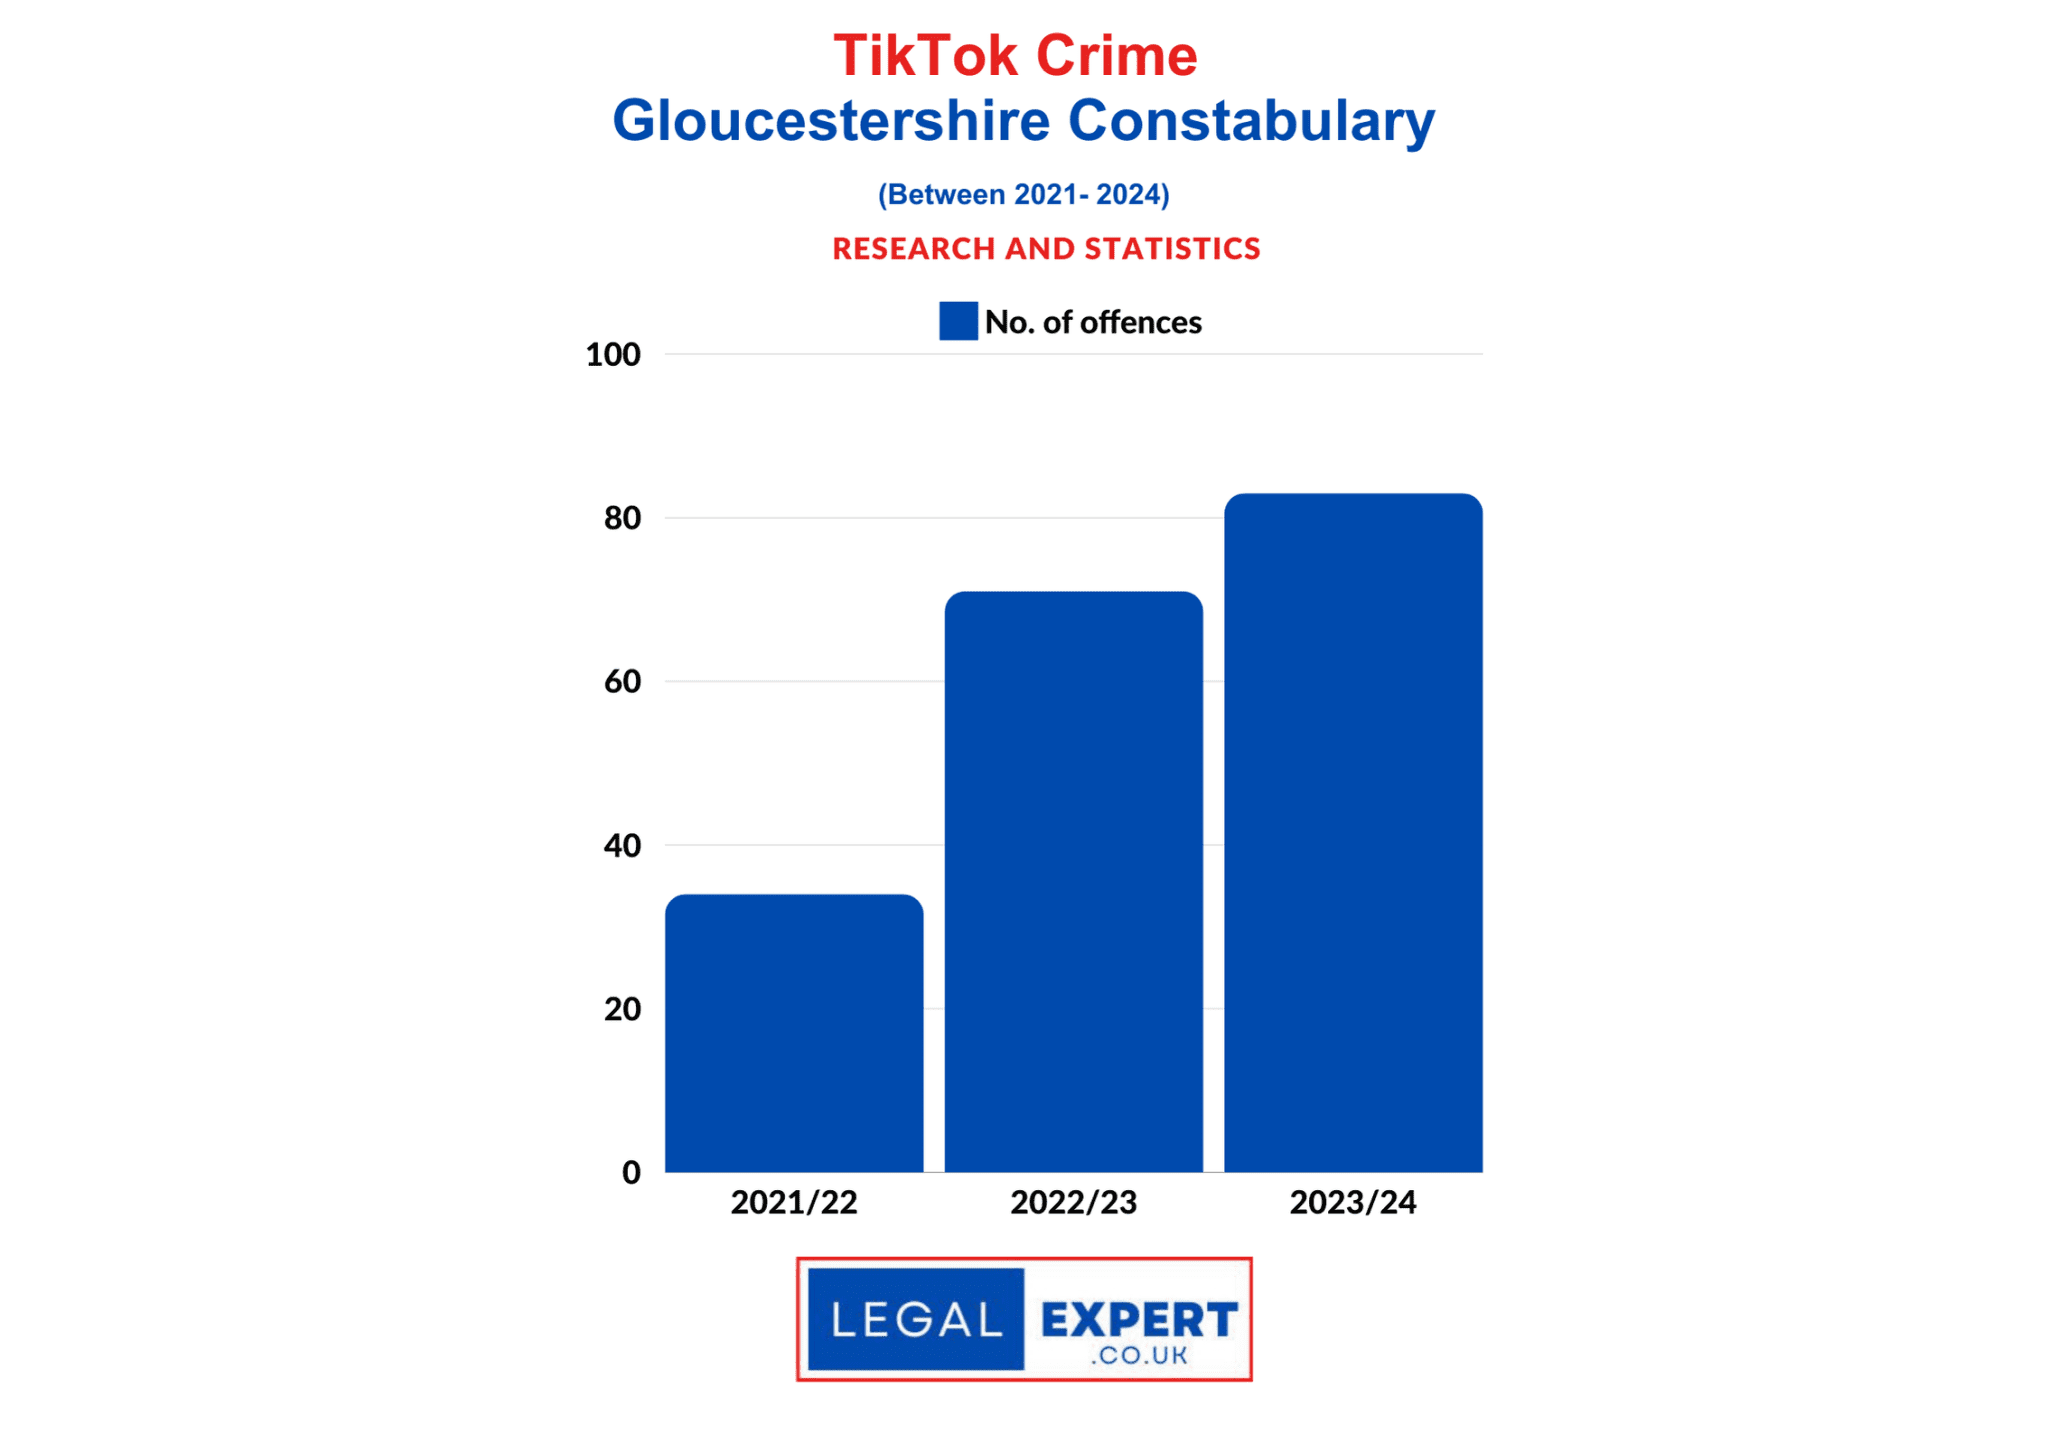
Gloucestershire Constabulary
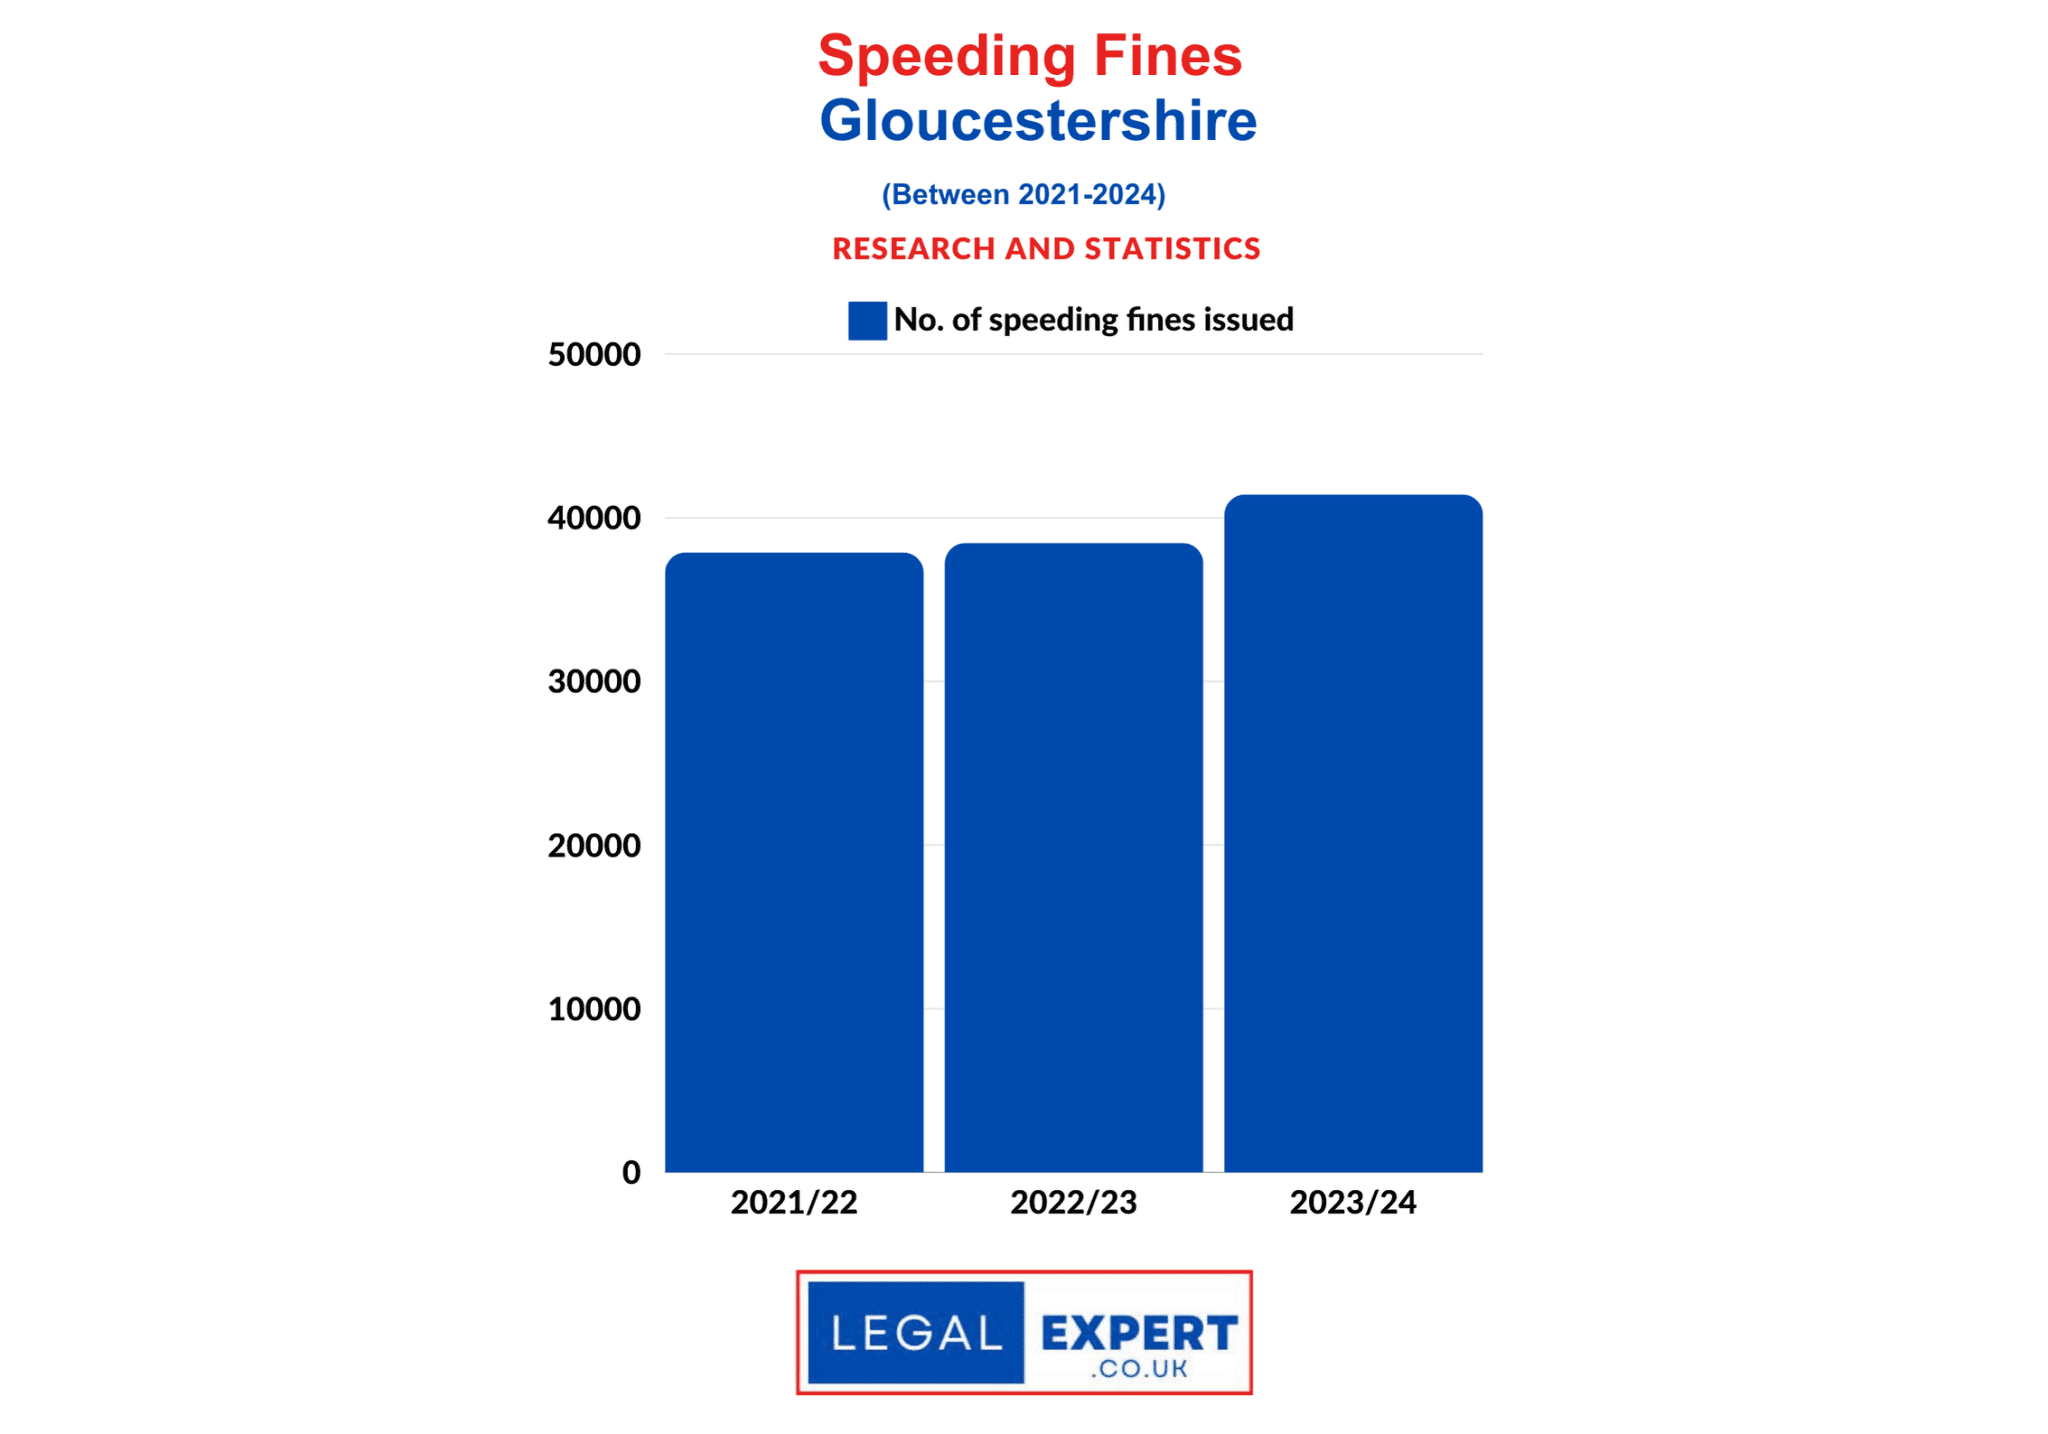
Speeding Offences – Gloucestershire
No. of speeding fines issued
2021/22 | 37,883
2022/23 | 38,458
2023/24 | 41,429
Total | 117,770
20 roads in Gloucestershire where drivers have been caught speeding (2023/24)
Location | No. of drivers who paid fine, had points on license or attended retraining course
- M5 MOTORWAY | 6939
- A38 QUEDGELEY BYPASS | 3619
- A417 BROCKWORTH BYPASS | 2545
- A40 OVER FARM | 1506
- A430 SECUNDA WAY | 1361
- A417 (T) SOUTH CERNEY JUNCTION | 971
- A417 HARNHILL ROAD BRIDGE | 893
- CORINIUM AVENUE | 894
- A417 DARTLEY BOTTOM | 638
- A4173 BROOKTHORPE | 692
- PIFFS ELM | 663
- A417 BETWEEN QUARRY JUNCTION AND DARTLEY BOTTOM | 533
- A419 STROUD ROAD | 613
- A417 COWLEY POLICE PLATFORM | 487
- A430 CASTLEMEADS WAY | 487
- B4696 SPINE ROAD EAST | 497
- A417 (T) BURFORD ROAD JUNCTION | 434
- A436 LINEOVER WOOD | 465
- BATH ROAD | 457
- A417 | 346
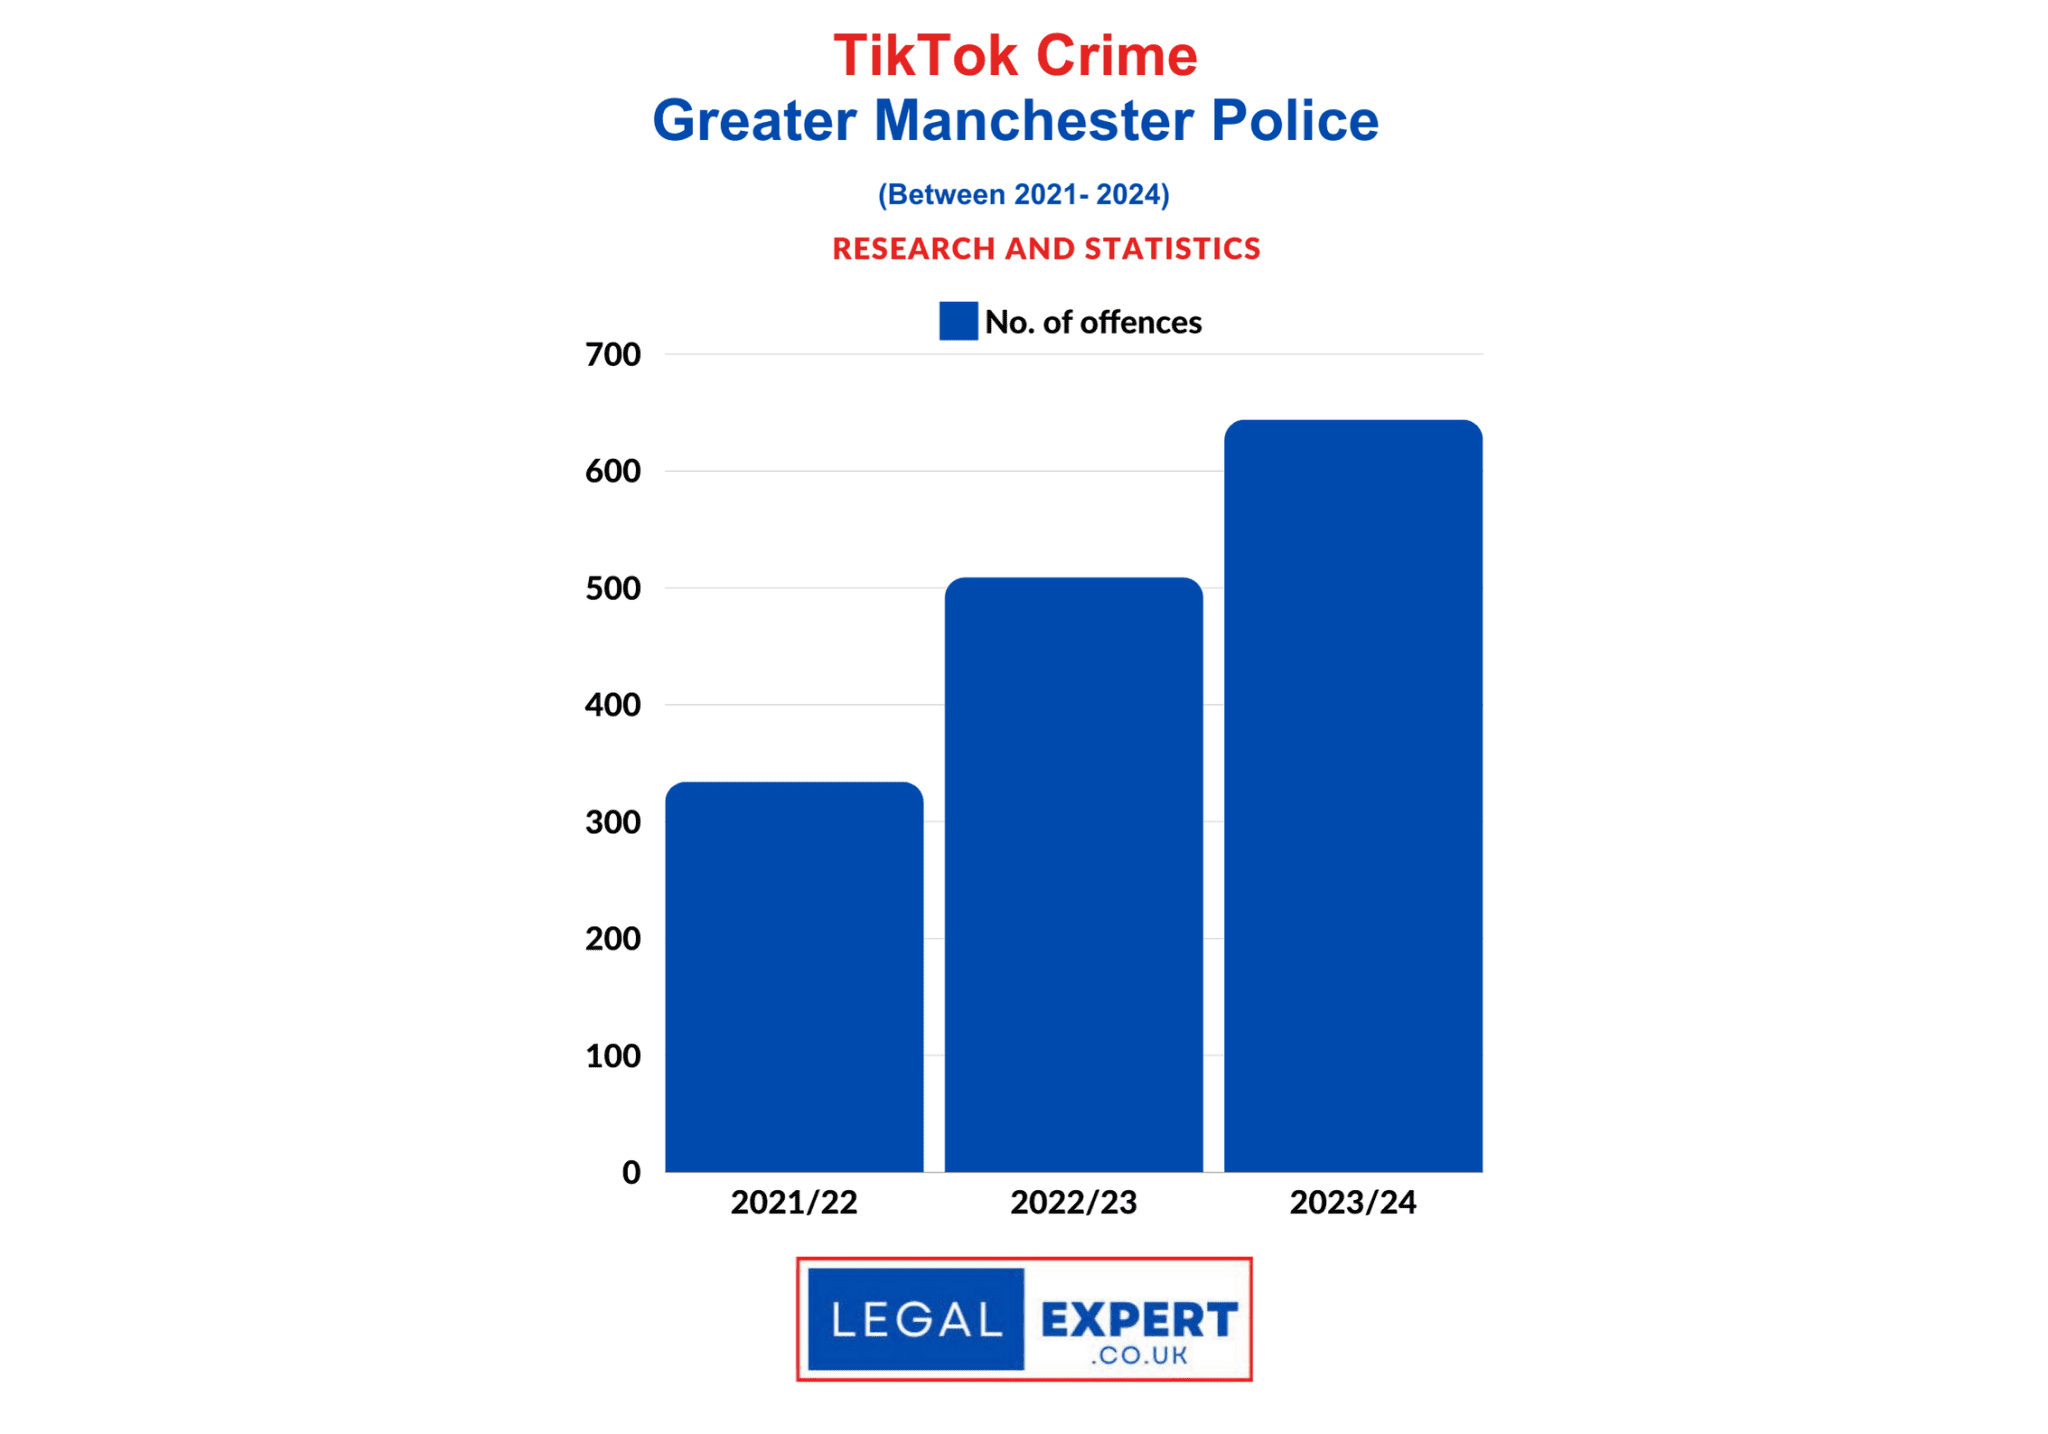
Greater Manchester Police
No. of speeding fines issued
2021/22 | 139,858
2022/23 | 154,349
2023/24 | 166,436
Total | 460,643
Gwent Police
No. of speeding fines issued
2021/22 | 22,923
2022/23 | 19,008
2023/24 | 30,437
2024/25 | 35,112
Total | 107,480
20 roads in Gwent where drivers have been caught speeding (2024/25)
| Location Address | Notices of Intended Prosecution issued |
| A472 Lower Race, Pontypool | 4,064 |
| M4 Newport Eastbound J25 to J24 | 2,953 |
| M4 Newport Westbound J26 to J28 | 2,648 |
| M4 Newport Eastbound J28 to J27 Malpas Straight | 2,426 |
| A467 Nr. Tregwilym Road Flyover | 2,283 |
| M4 Newport Eastbound J27 Malpas Straight to J26 | 1,494 |
| M4 Newport Westbound J23A to J25 | 1,327 |
| M4 Newport Eastbound J26 to J25A | 1,192 |
| A465 Gilwern to Clydach Westbound | 1,159 |
| M4 Newport Eastbound J25 to J24 A449 Off Slip | 1,106 |
| A465 Clydach to Gilwern Eastbound | 1,078 |
| Lower Machen Eastbound | 983 |
| M4 Westbound J24 to J25 | 864 |
| A465 Clydach to Brynmawr Westbound | 850 |
| A465 Brynmawr to Clydach Eastbound | 849 |
| M4 Newport Eastbound J25 to J24 A449 Off Slip | 800 |
| Lower Machen Westbound | 595 |
| M4 Newport Westbound J25a to J26 | 594 |
| Pant Road, Newbridge | 467 |
| M467 Risca Bypass Southbound | 413 |
Hampshire Constabulary
No. of speeding fines issued
2021/22 | 64,469
2022/23 | 59,278
2023/24 | 59,451
Total | 183,198
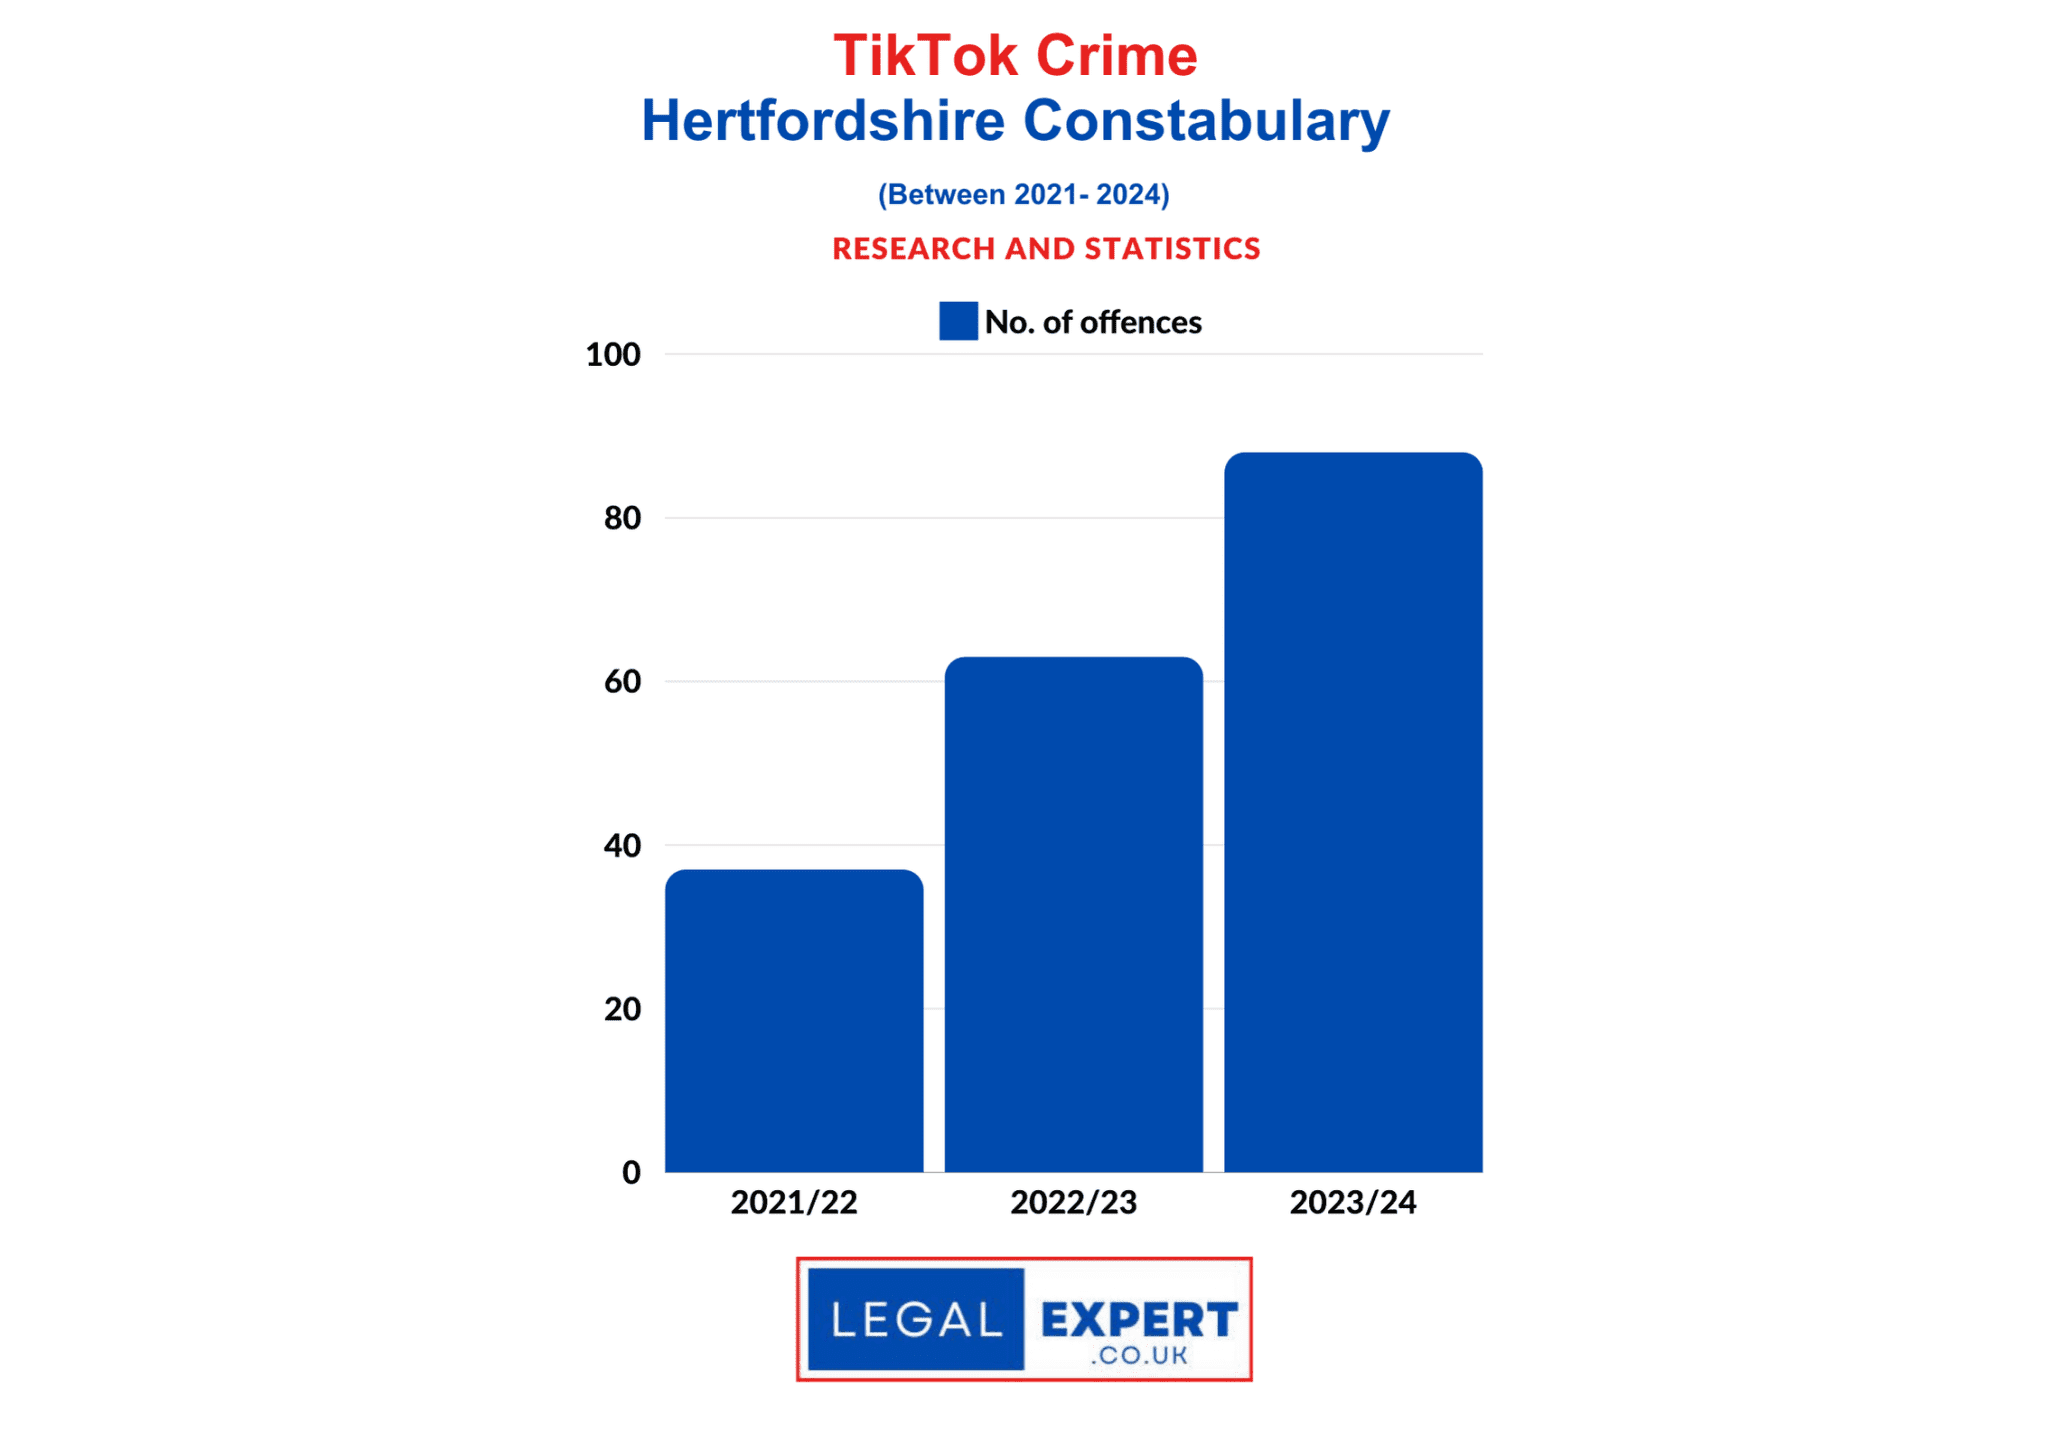
Hertfordshire Constabulary
No. of speeding fines issued
2021/22 | 52,541
2022/23 | 55,630
2023/24 | 49,755
Total | 157,926
20 roads in Hertfordshire where drivers have been caught speeding (2023/24)
| Location | Number of NIPs |
| M25 Motorway, Jnc 17-16, Anti-Clockwise | 4003 |
| M25 Motorway, Jnc 19-18, Anti-Clockwise | 3674 |
| M25 Motorway, Jnc 24-23, Anti-Clockwise | 3560 |
| M1 Motorway, Between Jnc 7-6A, Southbound | 3042 |
| M25 Motorway, Jnc 23-22, Anti-Clockwise | 2637 |
| B653 Lower Luton Road, South of Bowers Heath Lane, Southbound, Harpenden | 2572 |
| M1 Motorway, Between Jnc 8-9, Northbound | 2269 |
| A10 Great Cambridge Road, Northbound, Wormley | 2215 |
| A414 Stanstead Abbotts By-Pass, near Briggens Park, Eastbound, Stanstead Abbotts | 1302 |
| M25 Motorway, Jnc 19-20, Clockwise | 1172 |
| M1 Motorway, Between Jnc 9-8, Southbound | 1143 |
| A412 Rickmansworth Road, Northeast of Cassiobury Park Avenue, Northeast-bound, Watford | 1100 |
| A4125 Eastbury Rd, near Manning Court, bi-directional, Watford | 1095 |
| High Wych Rd, nr Rivers Hospital, Sawbridgeworth | 950 |
| M25 Motorway, Jnc 21A-22, Clockwise | 930 |
| A412 Scots Hill, near Copthorne Road, Eastbound, Croxley Green, Rickmansworth | 735 |
| A412 Uxbridge Road, west of Money Hill Road, Bi-directional, Rickmansworth | 733 |
| A414 St Albans Road, East of Wood Crescent, Westbound, Hemel Hempstead | 725 |
| A414 Stanstead Abbotts By-Pass, near Briggens Park, Westbound, Stanstead Abbotts | 709 |
| B4505 Chesham Road, Southwest of Hyde Lane, Bovingdon | 693 |
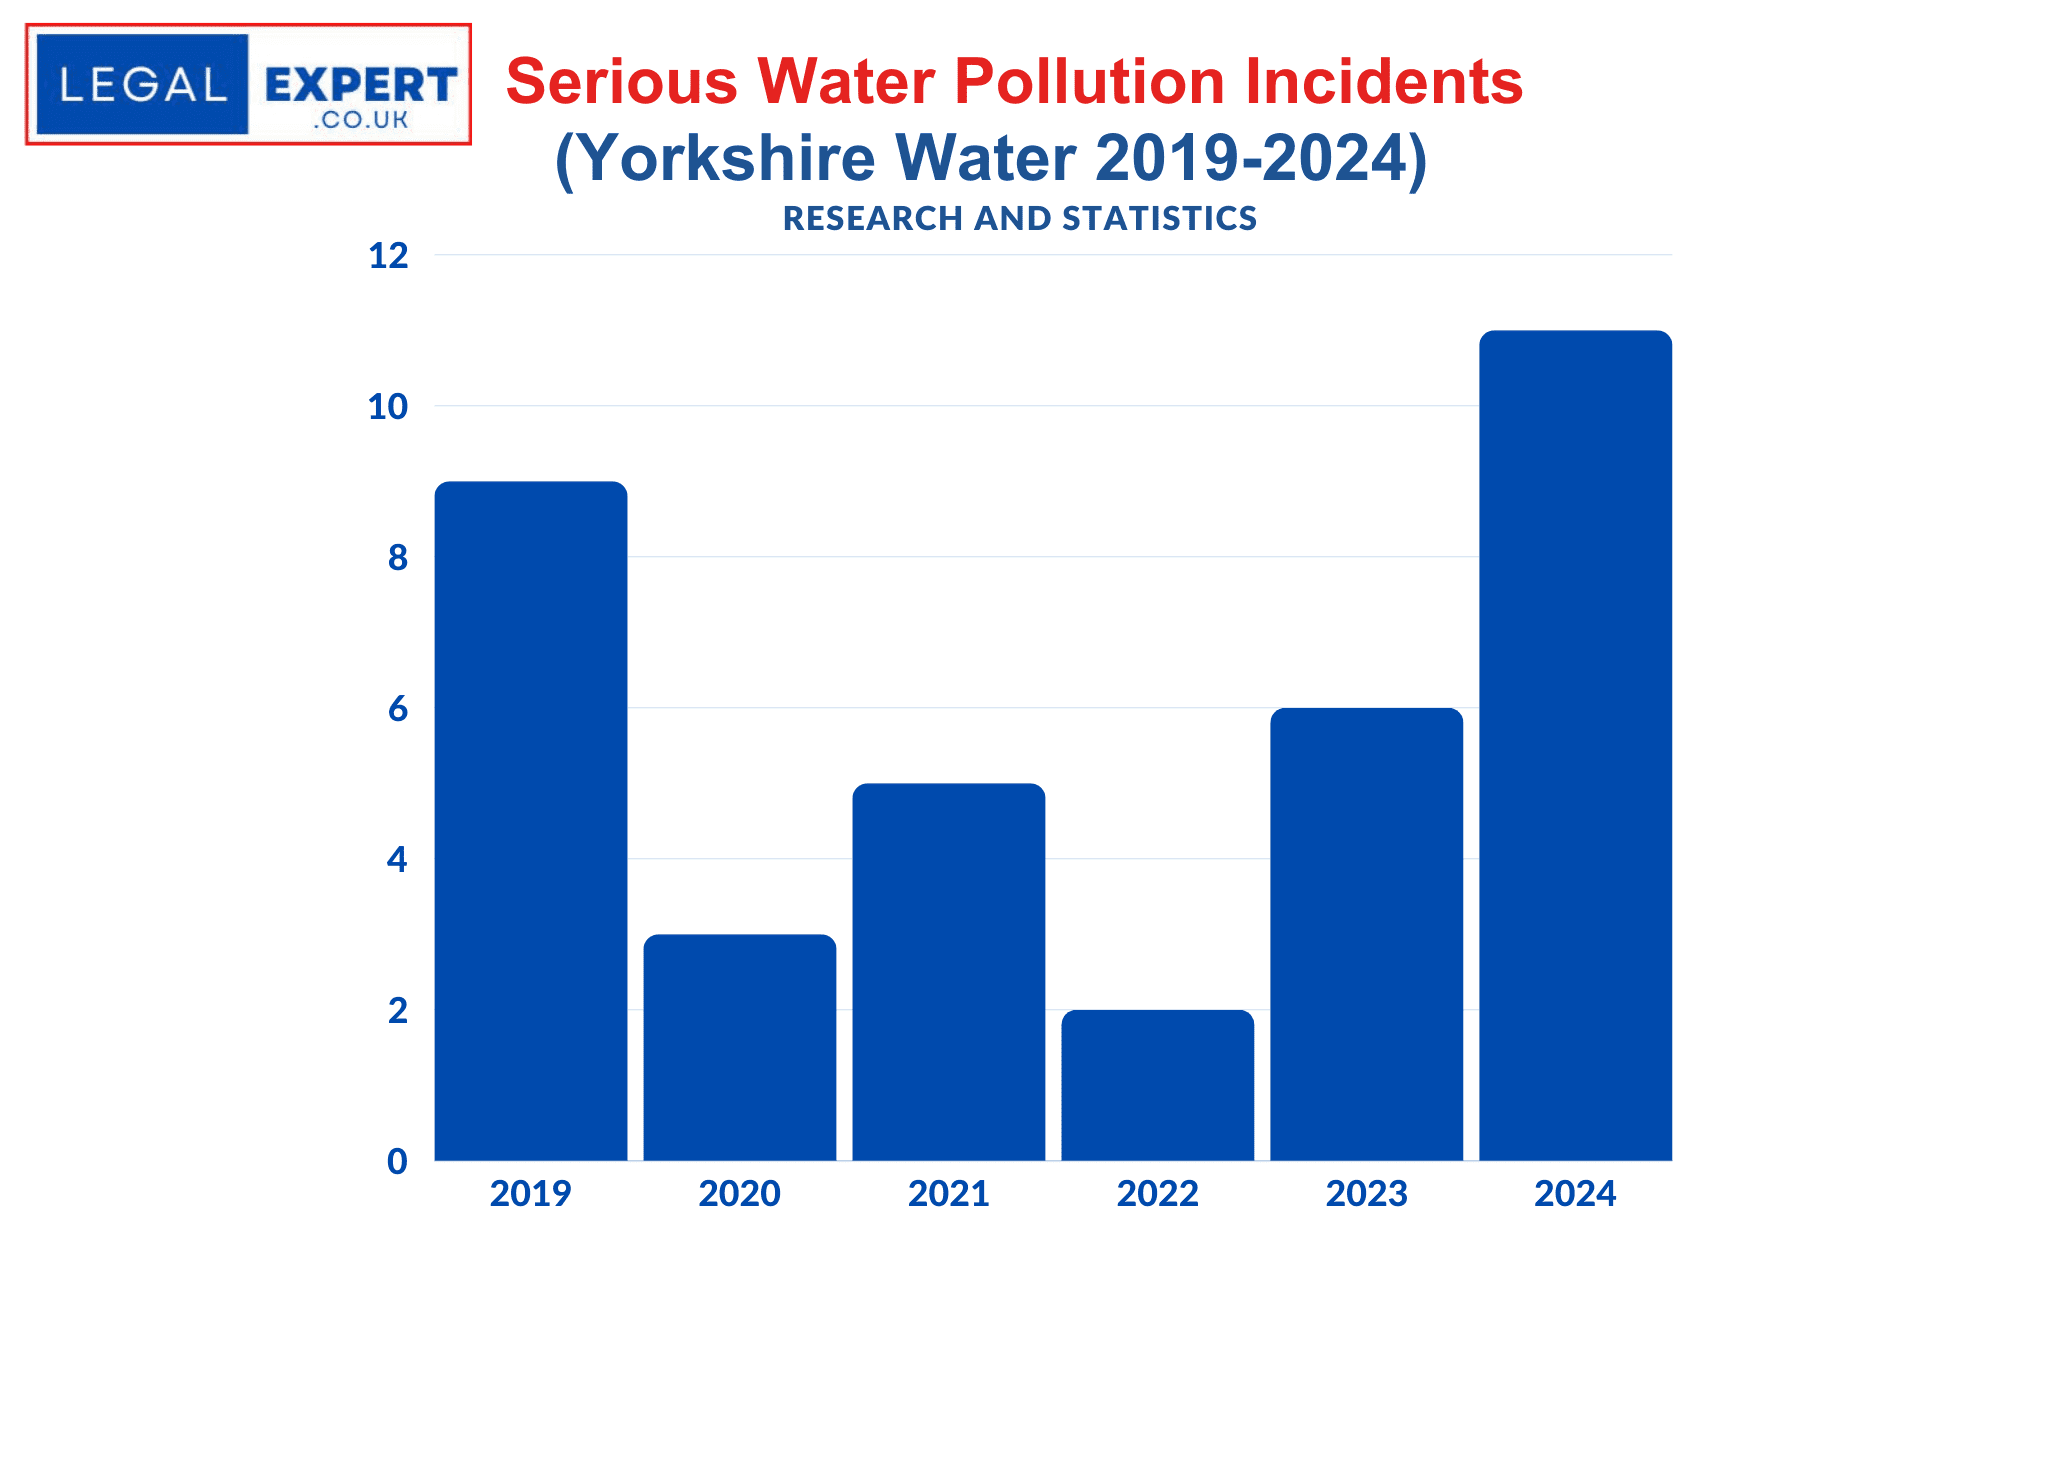
Humberside Police
No. of speeding fines issued
2021/22 | 52,933
2022/23 | 49,885
2023/24 | 49,712
Total | 152,530
20 roads in Hull and East Yorkshire where drivers have been caught speeding (2023/24)
Location | No. of People Exceeding Speed Limit
- M62 OUSE BRIDGE EASTBOUND | 4439
- M62 BETWEEN COUNTY BOUNDARY AND JUNCTION 35 | 3191
- M62 BETWEEN JUNCTION 37 AND JUNCTION 38 | 2409
- A180, Cleethorpe Road | 1863
- A63 IN THE VICINITY OF SOUTH HUNSLEY SCHOOL | 1516
- M62 OUSE BRIDGE WESTBOUND | 1504
- M180 | 1367
- A1105 BOOTHFERRY ROAD | 1120
- A15 | 746
- A16 PEAKS PARKWAY (40MPH) | 727
- M180 | 675
- A16 PEAKS PARKWAY (40MPH) | 646
- A63 BETWEEN NORTH CAVE AND SOUTH CAVE | 642
- M180, BETWEEN JUNCTION 3 AND JUNCTION 4 | 595
- A1079 | 495
- B1253 SLEDMERE (30MPH) | 433
- A180 | 432
- HUMBER BRIDGE | 431
- A1173 KINGS ROAD | 421
- BESSINGBY ROAD | 399
Kent Police
No. of speeding fines issued
2021/22 | 82,288
2022/23 | 79,018
2023/24 | 71,961
Total | 233,267
20 roads in Kent where drivers have been caught speeding (2023/24)
Location | No. of People Exceeding Speed Limit
- M25 Clockwise Junction 5 to Clacket Lane Services, Westerham/M25 Anti-Clockwise Clacket Lane Services to Junction 5 | 8836
- M25 Clockwise, Swanley/M25 anti-clockwise, Swanley | 7212
- A229 Chatham Road, Boxley | 4905
- A282 Dartford Tunnel Approach Road/ A282 Dartford East/West Tunnels | 3841
- A249 Detling | 2445
- A229 Loose Road Near Plains Avenue Maidstone | 1742
- M20 London Bound, Junctions 4-3, West Malling | 1439
- A228 Ashton Way, West Malling |1437
- M20 Coastbound, Junction 8 to 9, Ashford/ M20 Londonbound, Junction 9 to 8, Ashford | 1430
- Hoath Way, Gillingham | 1384
- M2 A carriageway, Ospringe/ M2 B carriageway, Ospringe | 1012
- Bradbourne Vale Road, Sevenoaks | 969
- A299 Thanet Way, Whitstable | 958
- A2050 Rheims Way, Canterbury | 894
- A26, Hadlow | 881
- Maidstone Road, Borstal | 849
- A264 Pembury Road, Tunbridge Wells | 755
- A259 Hythe Road, Dymchurch | 649
- A229 City Way, Rochester | 649
- A227 Wrotham Road, nr Huntingfield Road, Meopham | 647
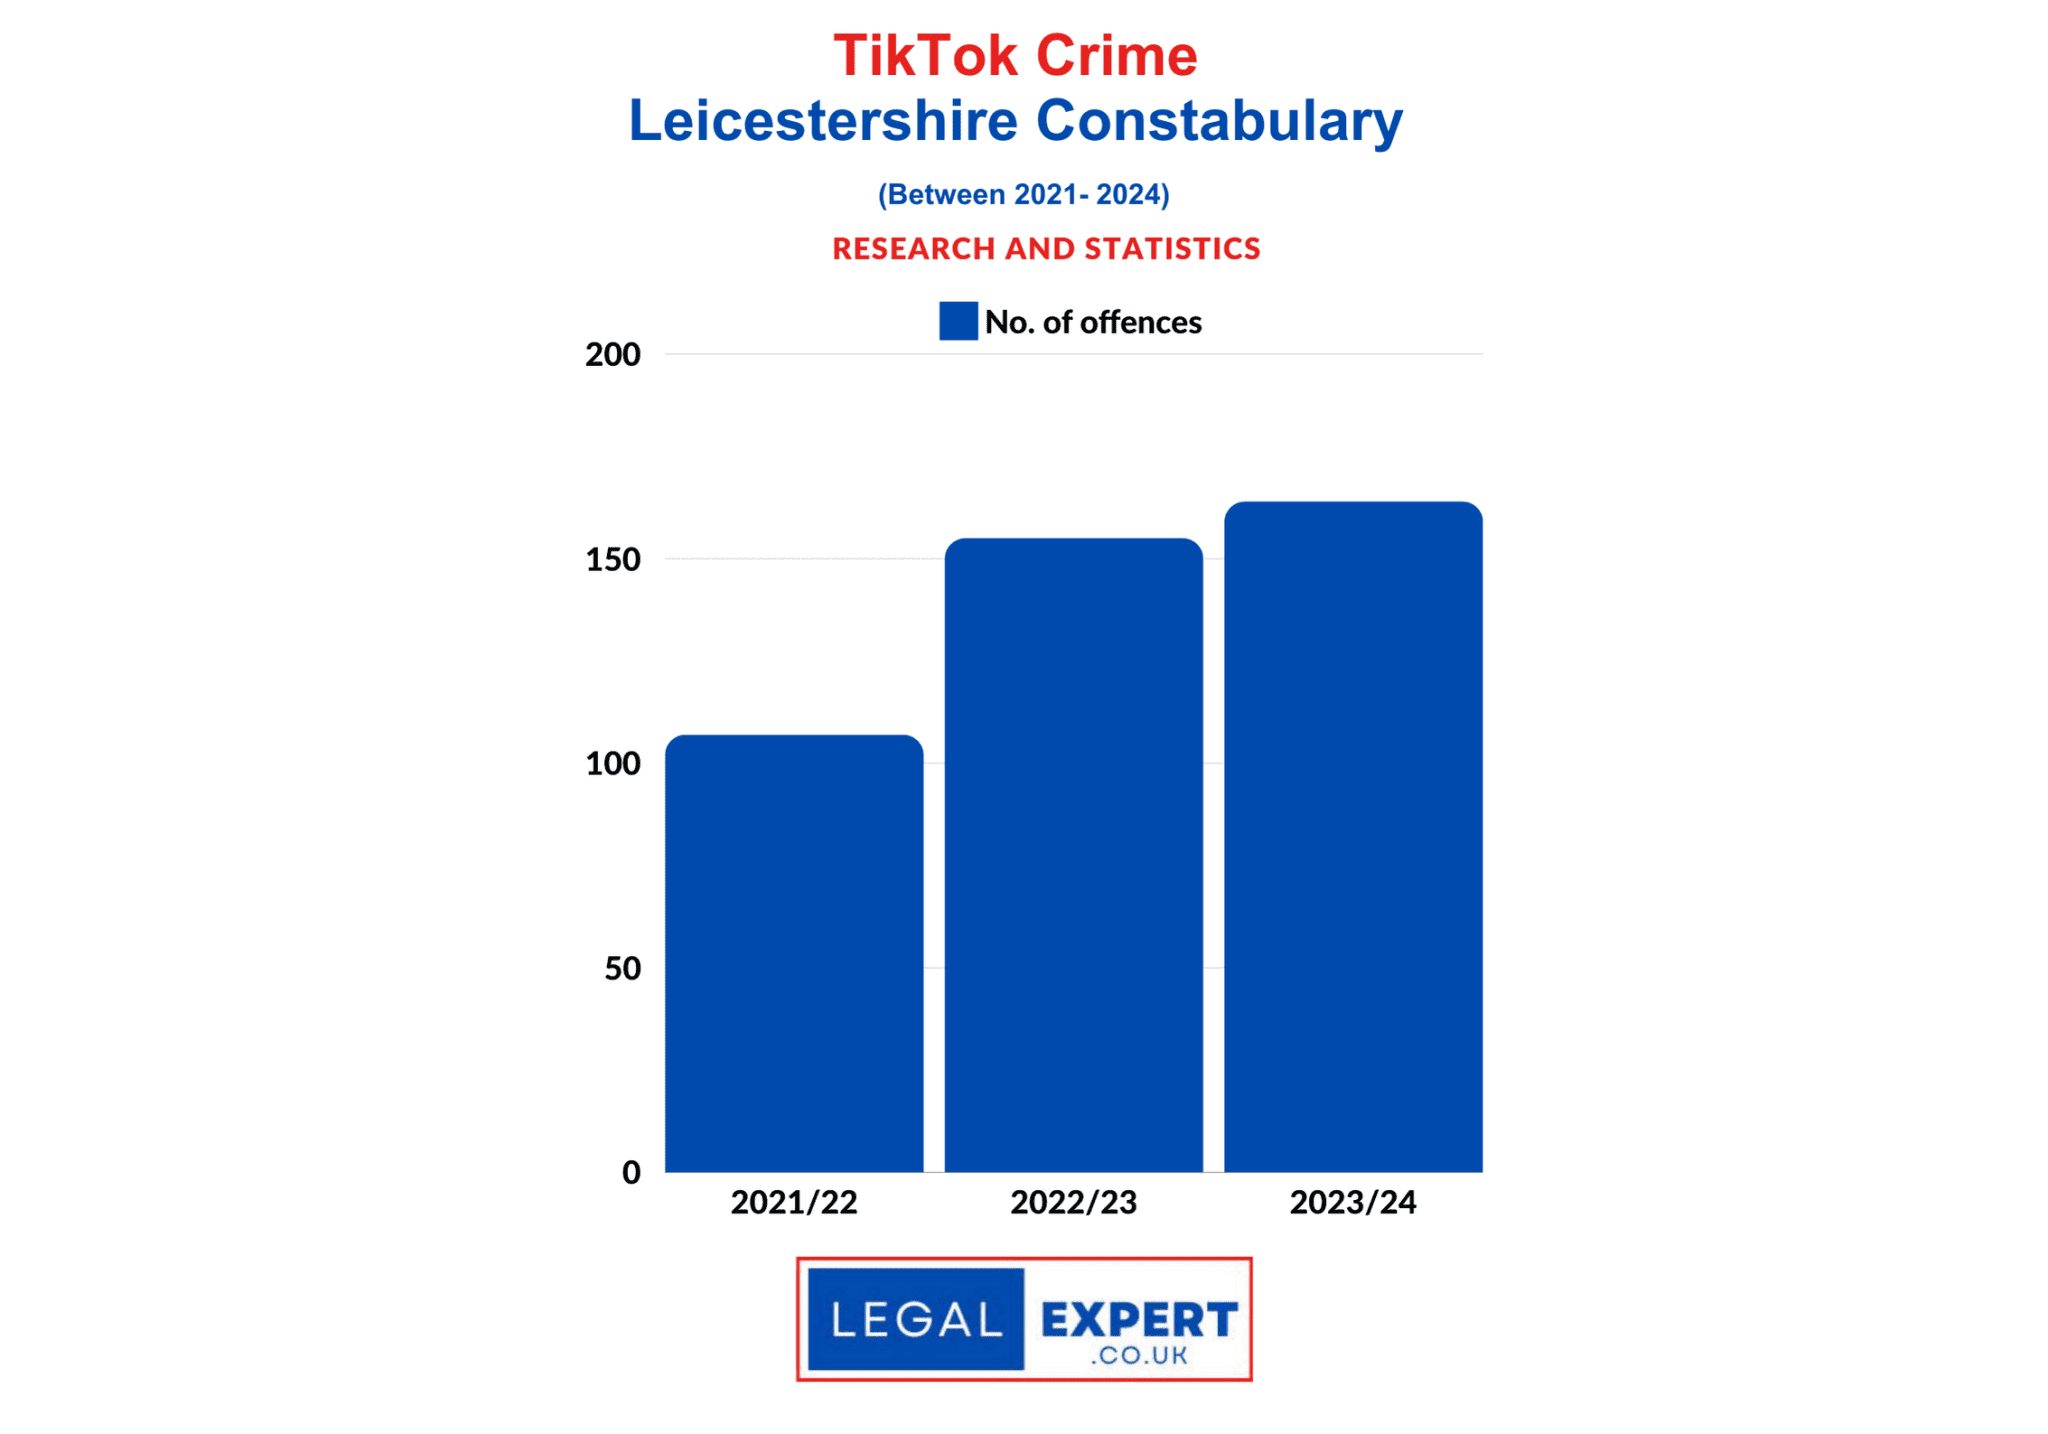
Leicestershire Constabulary
No. of speeding fines issued
2021/22 | 58,324
2022/23 | 53,256
2023/24 | 55,033
Total | 166,613
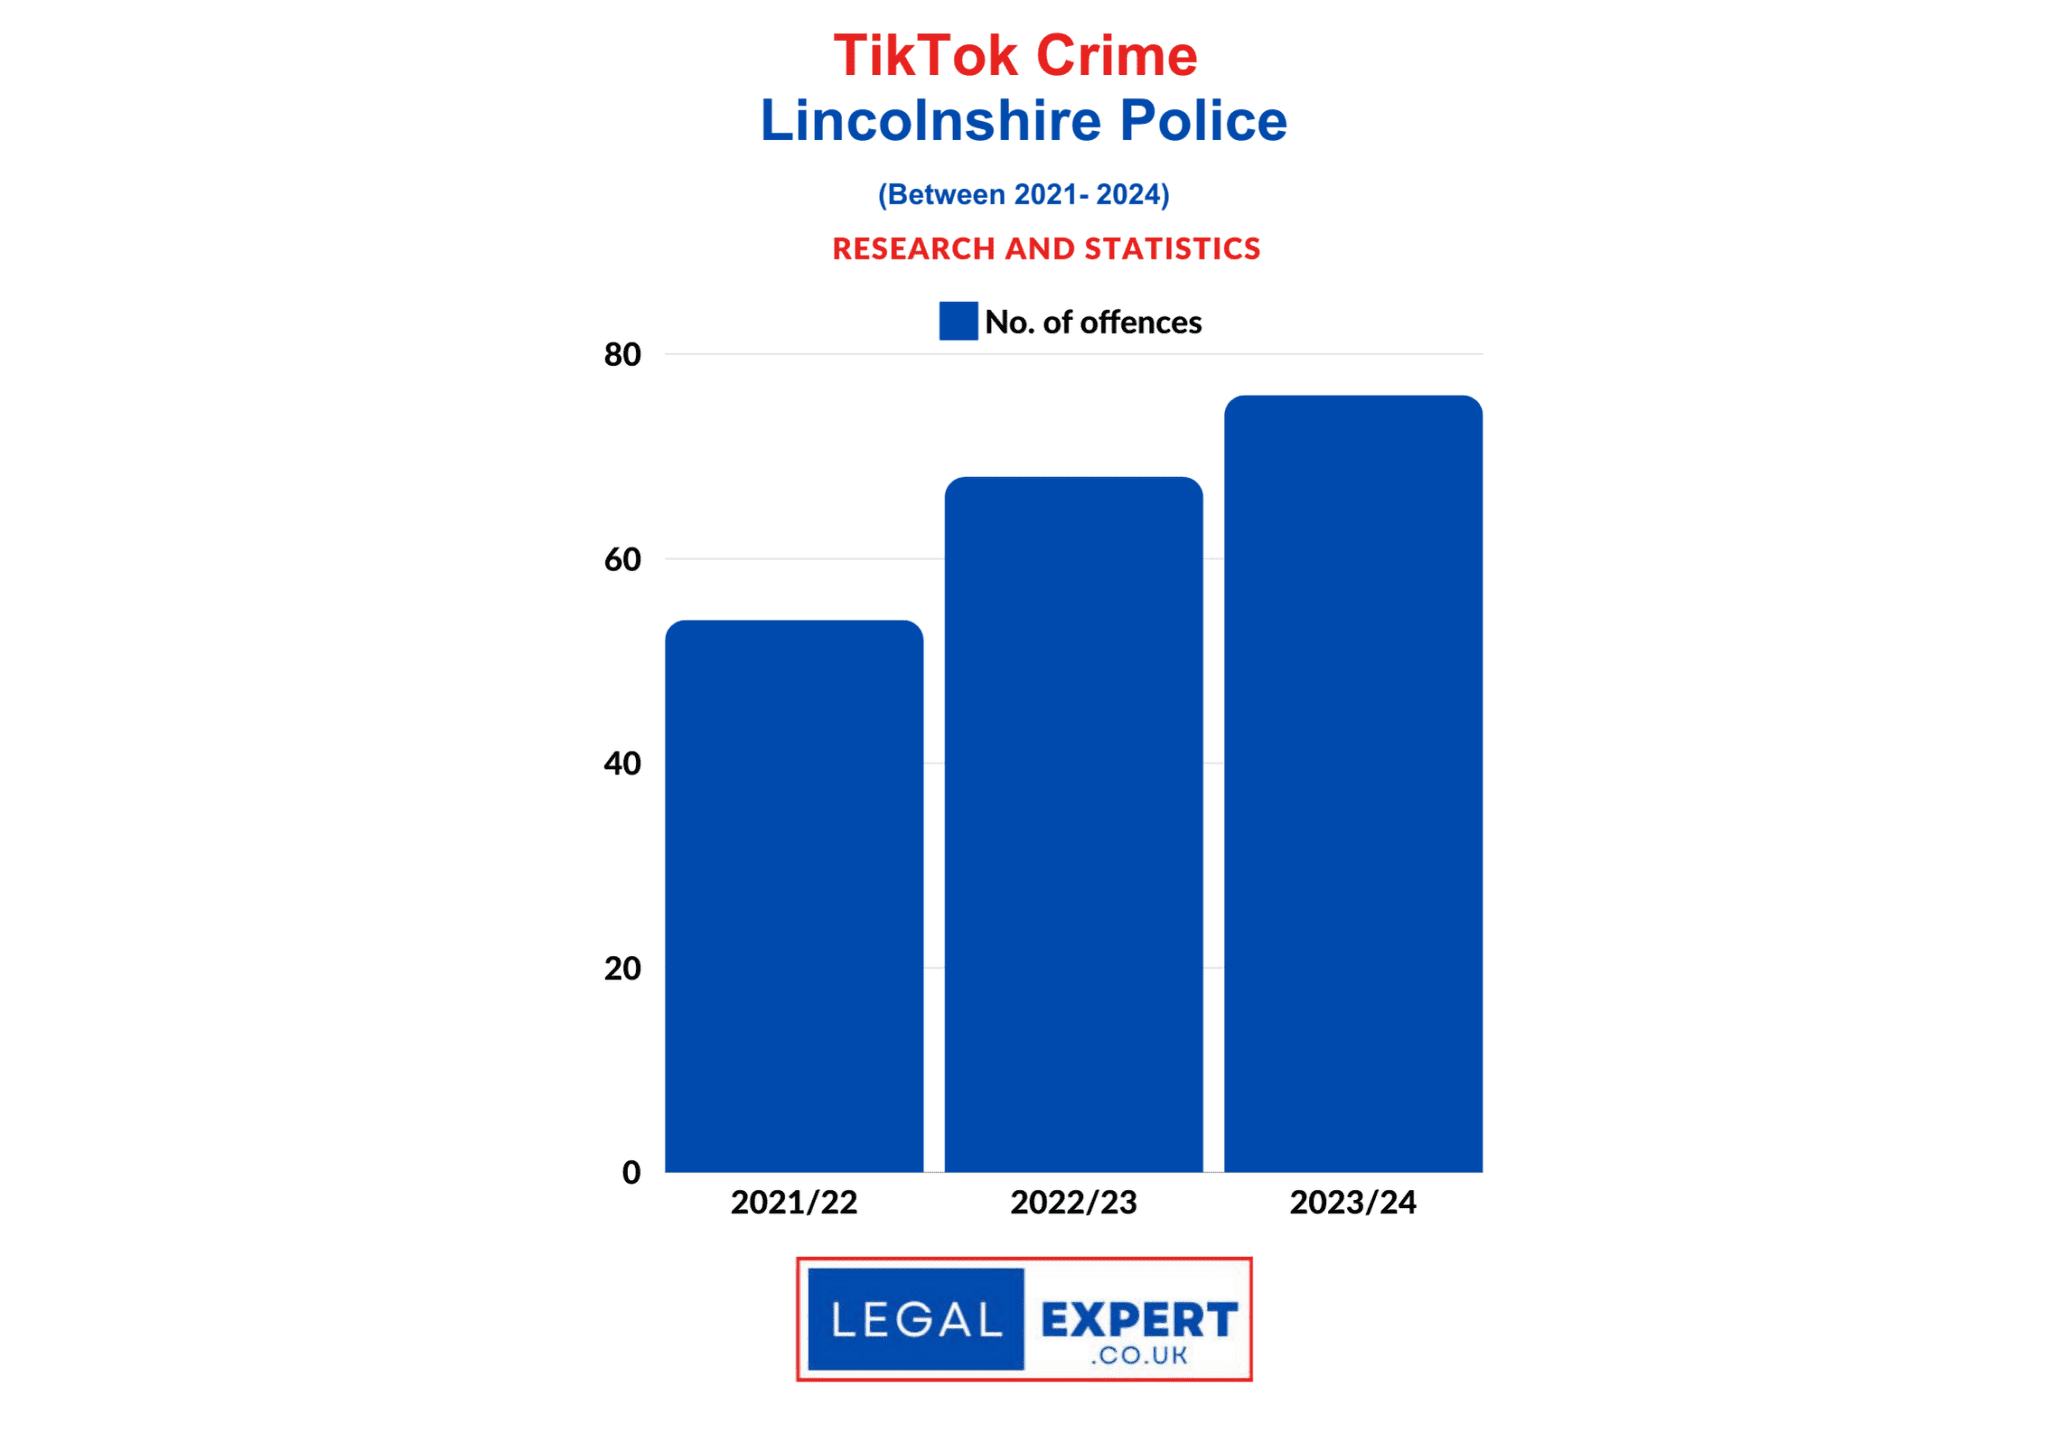
Lincolnshire Police
No. of speeding fines issued
2021/22 | 62,640
2022/23 | 54,835
2023/24 | 54,691
Total | 172,166
20 roads in Lincolnshire where drivers have been caught speeding (2023/24)
Location | No. of Speeding Offences
| Location | Offences |
| A153 MAIN ROAD, ANWICK | 7880 |
| A1434 BUNKERS HILL, LINCOLN | 5389 |
| A1, BARROWBY THORNS | 5316 |
| A151 MAIN ROAD, WHAPLODE | 4766 |
| A153 BUTTS LANE, TATTERSHALL | 3380 |
| A151 HOLBEACH ROAD, SPALDING | 2446 |
| LINCOLN ROAD, NORTH HYKEHAM | 2001 |
| BARRIER BANK, COWBIT | 1889 |
| A607 CROSS O’CLIFF HILL, LINCOLN | 1833 |
| A46 LINCOLN BYPASS, LINCOLN | 490 |
| B1174 South Parade, Grantham | 489 |
| B1188, BRANSTON | 422 |
| WEST MARSH ROAD, SPALDING | 385 |
| A46 – CAISTOR ROAD, MIDDLE RASEN | 384 |
| SKELLINGTHORPE ROAD, LINCOLN | 361 |
| BRANT ROAD, LINCOLN | 340 |
| A16 PARTNEY ROAD, SPILSBY | 317 |
| A1434 Broadgate, Lincoln S/B | 295 |
| A1434 Broadgate, Lincoln N/B | 252 |
| A1104 Beesby Road, Maltby Le Marsh | 233 |
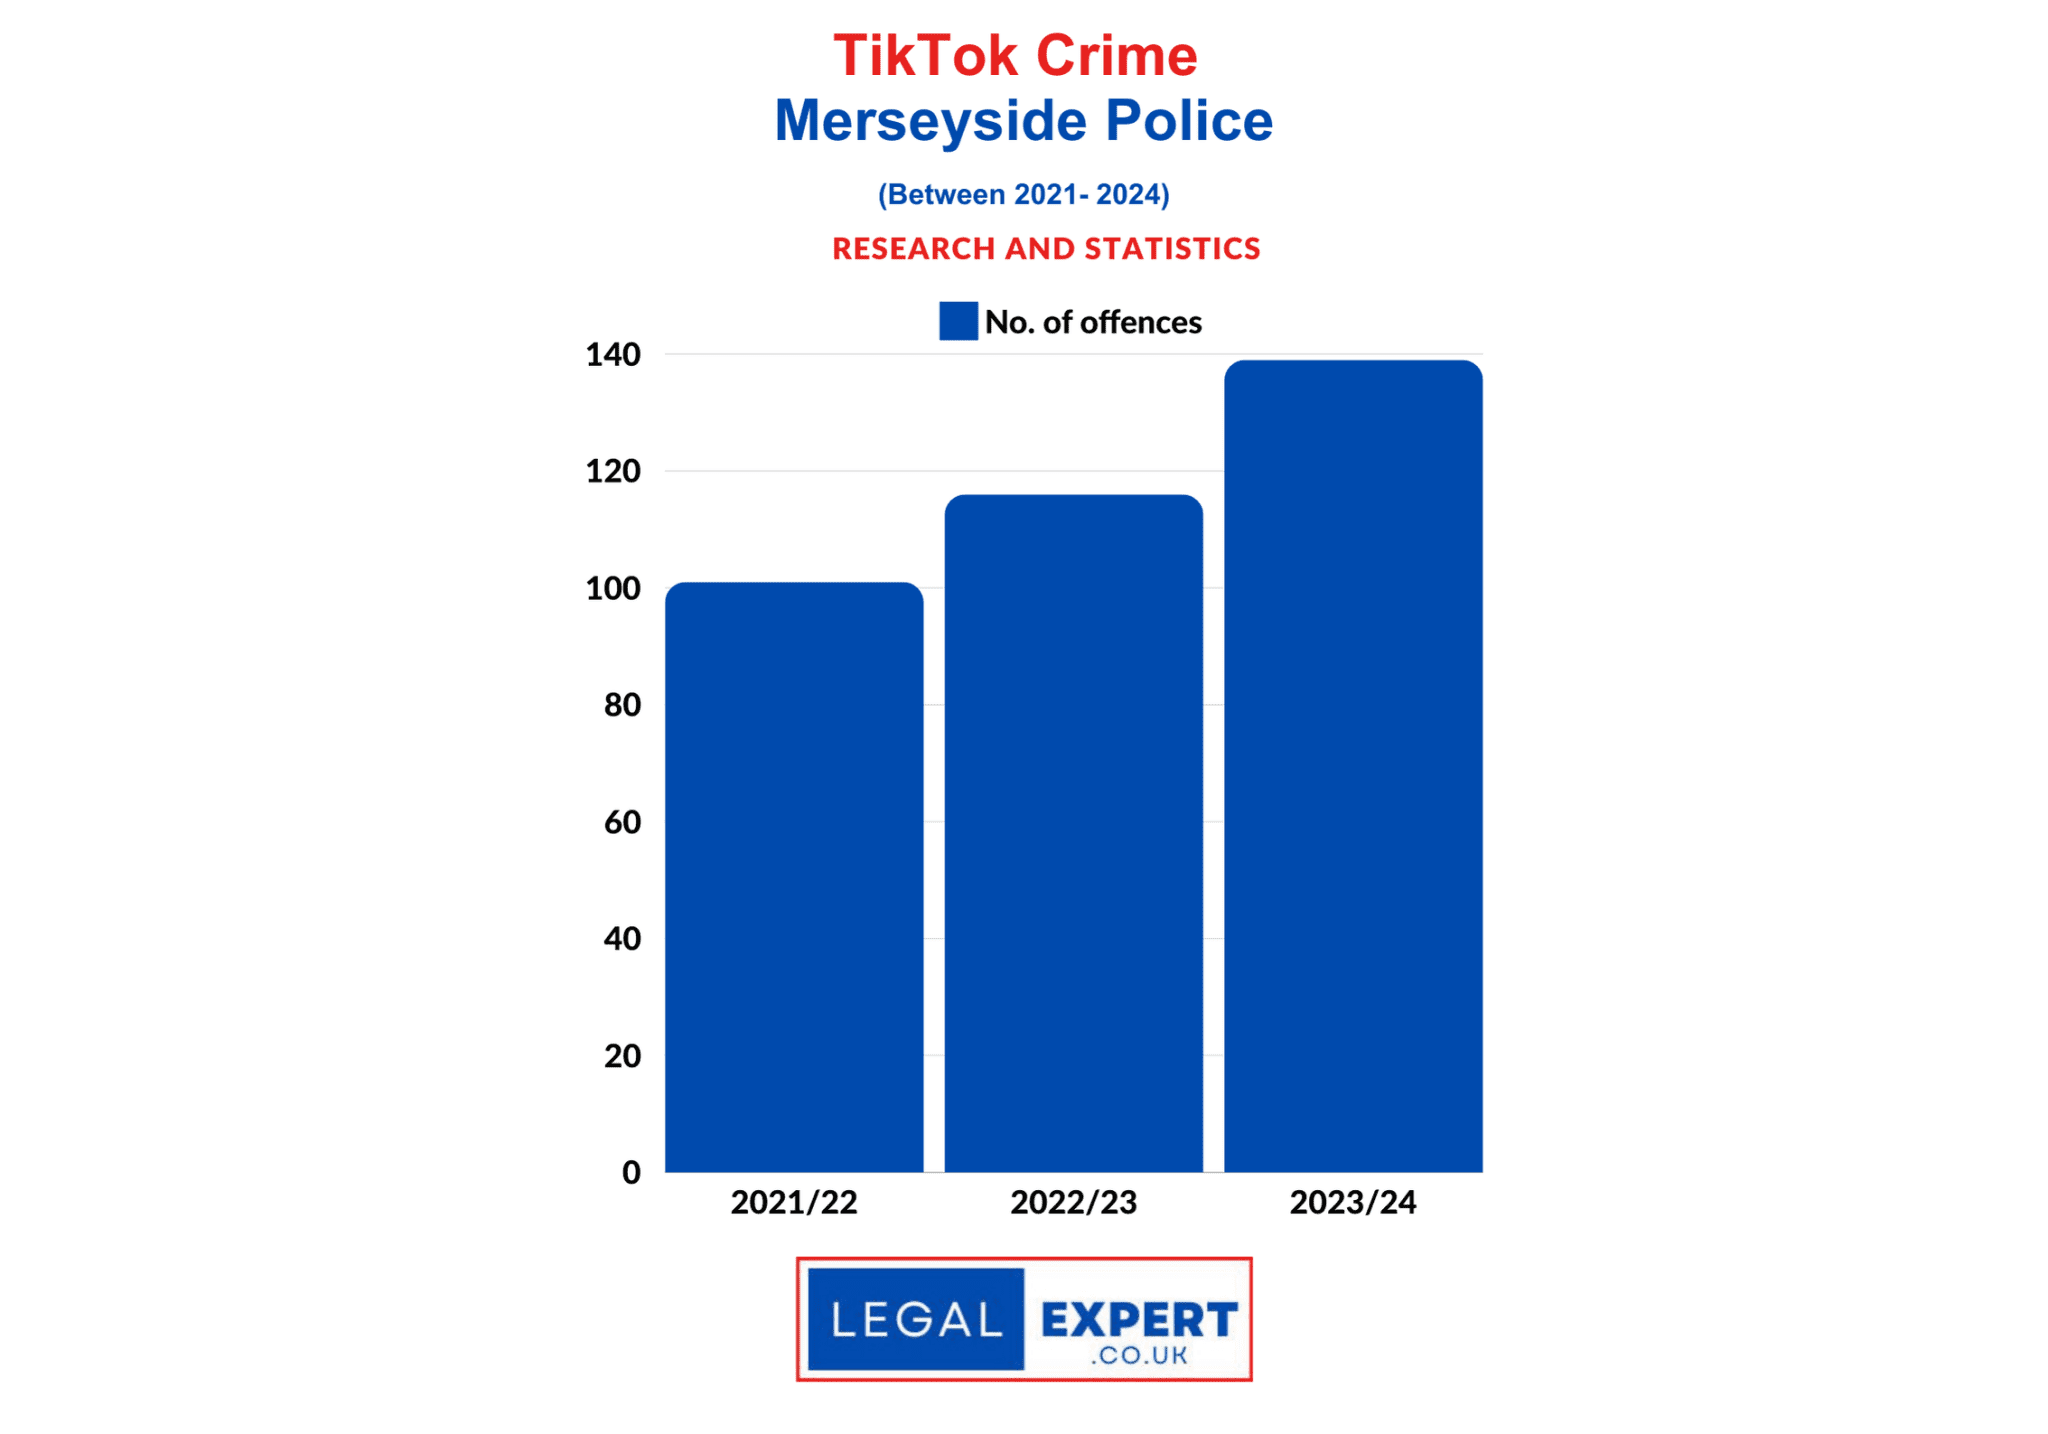
Merseyside Police
No. of speeding fines issued
2021/22 | 62,610
2022/23 | 55,541
2023/24 | 60,074
Total | 178,225
20 roads in Merseyside where drivers have been caught speeding (2023/24)
Location | No. of People Exceeding Speed Limit
- M62 (Westbound) | 7957
- Garston Way / Dock Road | 7157
- Leeds Street/Vauxhall Road | 4470
- Edge Lane Drive (Eastbound) | 2317
- A580 EAST LANCASHIRE ROAD BETWEEN SADLER’S LANE AND RAINFORD ROAD, ST HELENS, WA10 | 1843
- Scotland Road between Dryden Street & Leeds Street | 1679
- Balliol Road East (Westbound) | 1663
- SCOTLAND ROAD between WILBRAHAM STREET and LEEDS STREET | 1633
- Aigburth Road / Mersey Road | 1601
- New Chester Road (A41)/Turbine Road (Northbound) | 1324
- Lower House Lane between East Lancashire Road & Carr Lane | 1304
- Scotland Road between Leeds Street & Dryden Street | 1235
- A554 NORTH WALLASEY APPROACH ROAD between BAYSWATER ROAD and GREEN LANE | 1234
- Crosby Road South/Cambridge Road (Southbound) | 962
- Townsend Avenue between Queens Drive Walton & East Lancashire Road | 824
- ST HELENS LINKWAY BETWEEN THE SCORES BRIDGE AND ELTON HEAD ROAD | 809
- Saughall Massie Road | 799
- Scotland Road (Northbound) | 798
- Seth Powell Way/Woolfall Heath Avenue | 733
- A59 Northway | 728
Norfolk Constabulary
No. of speeding fines issued
2021/22 | 49,389
2022/23 | 58,772
2023/24 | 51,051
Total | 159,212
20 roads in Norfolk where drivers have been caught speeding (2023/24)
Location | No. of Speeding Offences
| Road Name | Number of Offences |
| A47 | 4764 |
| A134 | 3372 |
| A147 | 1982 |
| A140 Colman Road | 1725 |
| A149 | 1575 |
| A10 | 1573 |
| A140, Mile End Road | 1516 |
| A143 | 1448 |
| A1067 | 1223 |
| A146 | 1136 |
| A1074, Dereham Rd
(outbound) |
1063 |
| A11 | 1011 |
| A146 Barrett Road | 919 |
| A148 | 905 |
| C494 | 873 |
| A147, Koblenz Avenue | 860 |
| A140 | 824 |
| B1140 | 801 |
| A1270 | 800 |
| B1108 | 789 |
North Wales Police
No. of speeding fines issued
2021/22 | 58,581
2022/23 | 57,135
2023/24 | 60,360
Total | 176,076
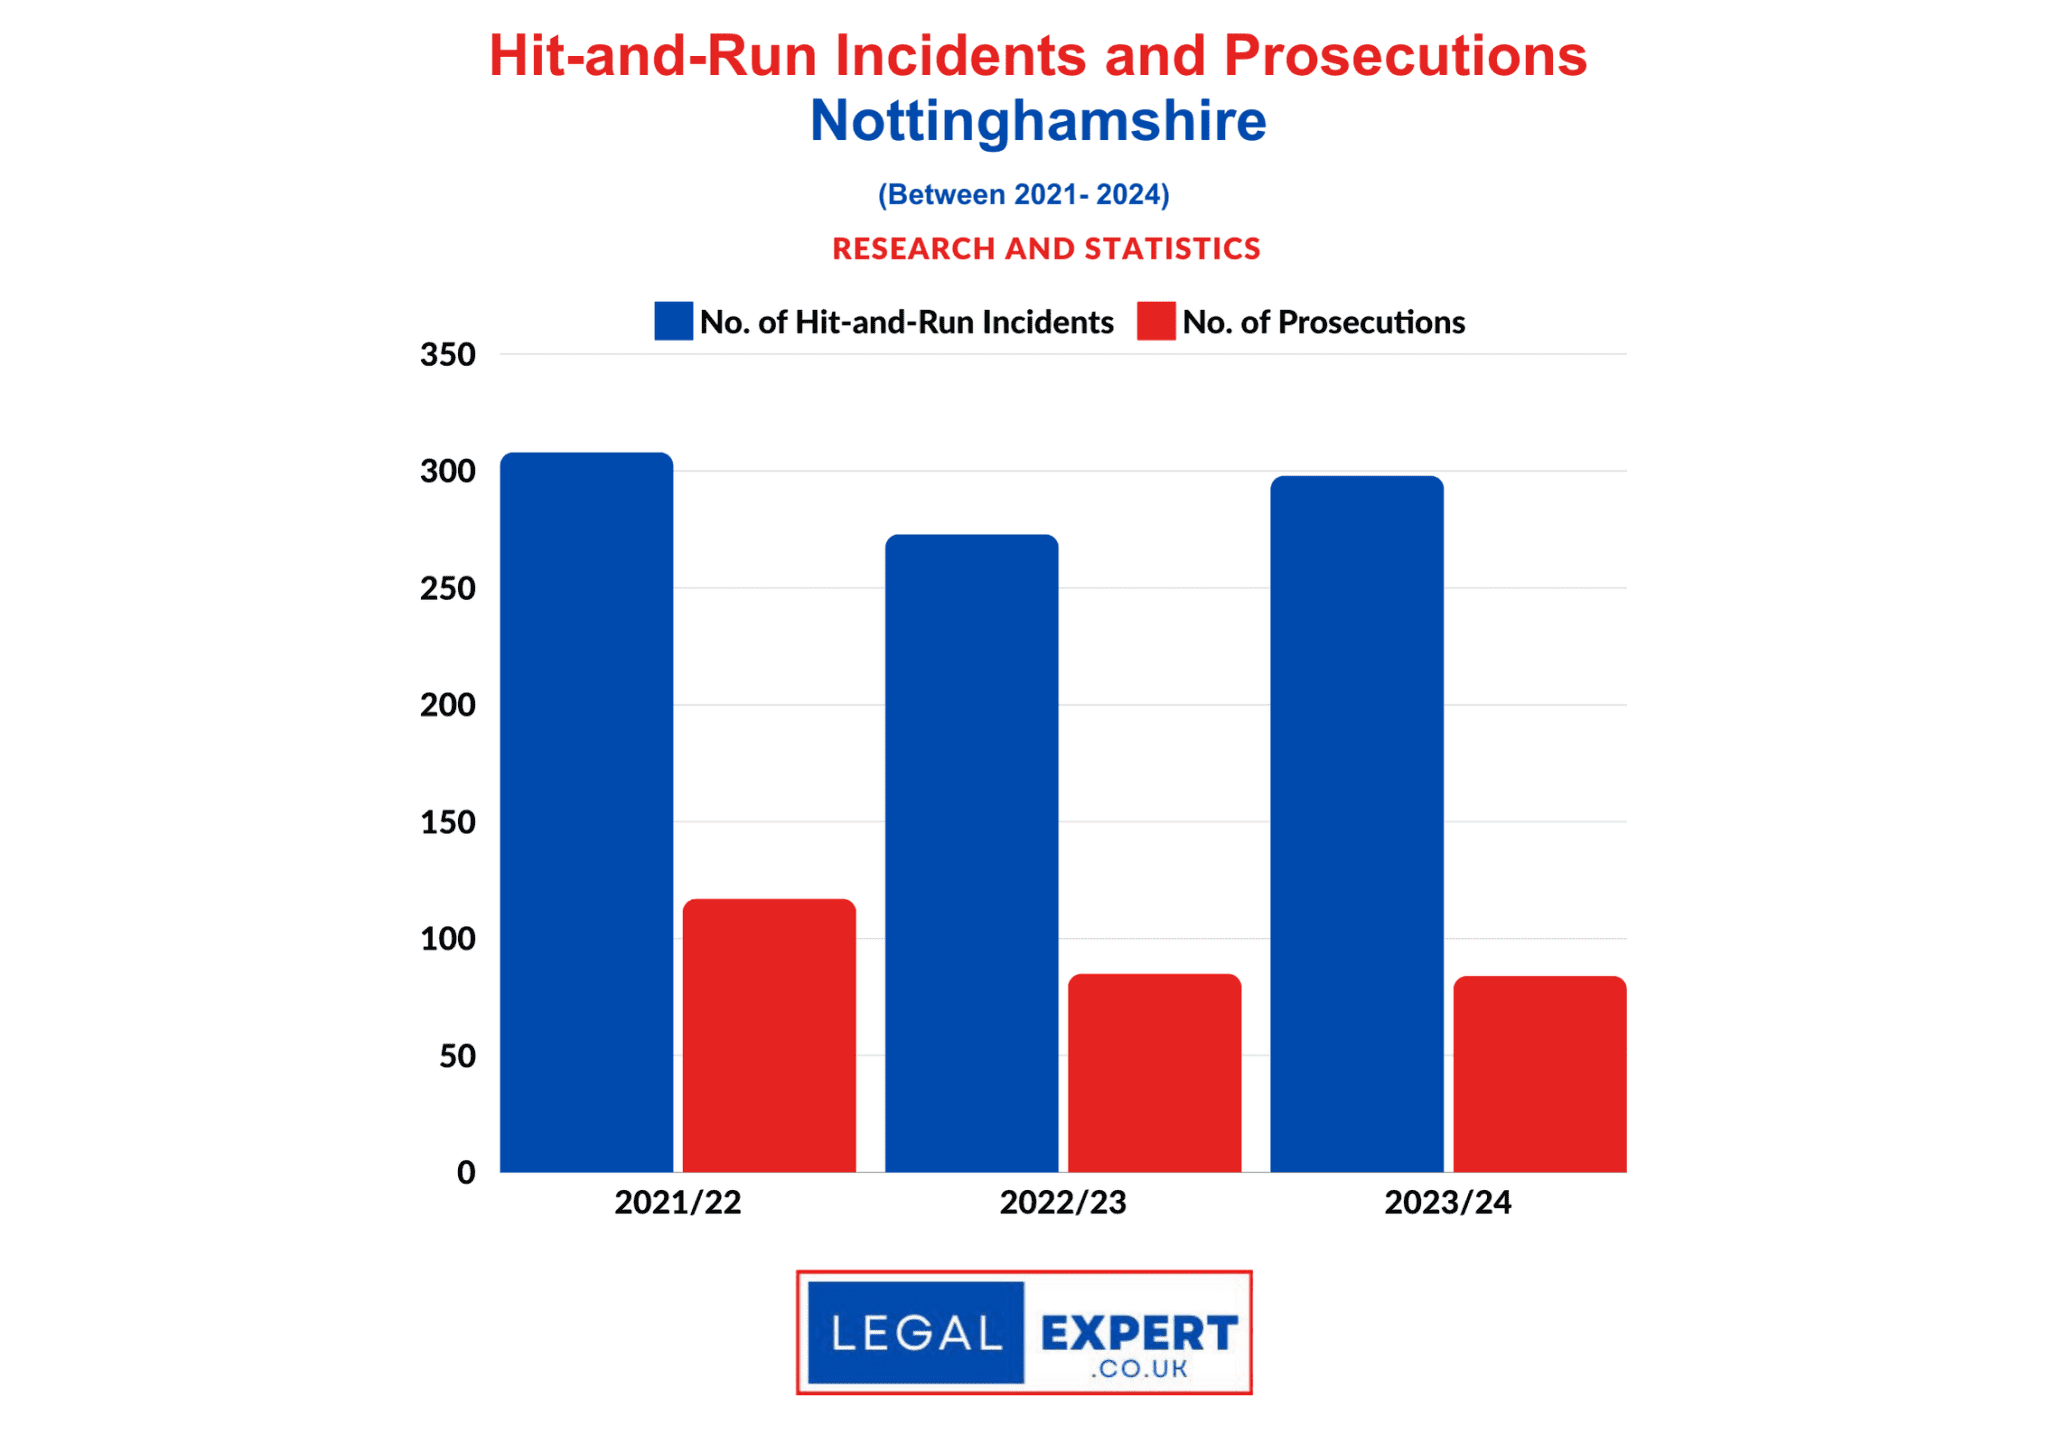
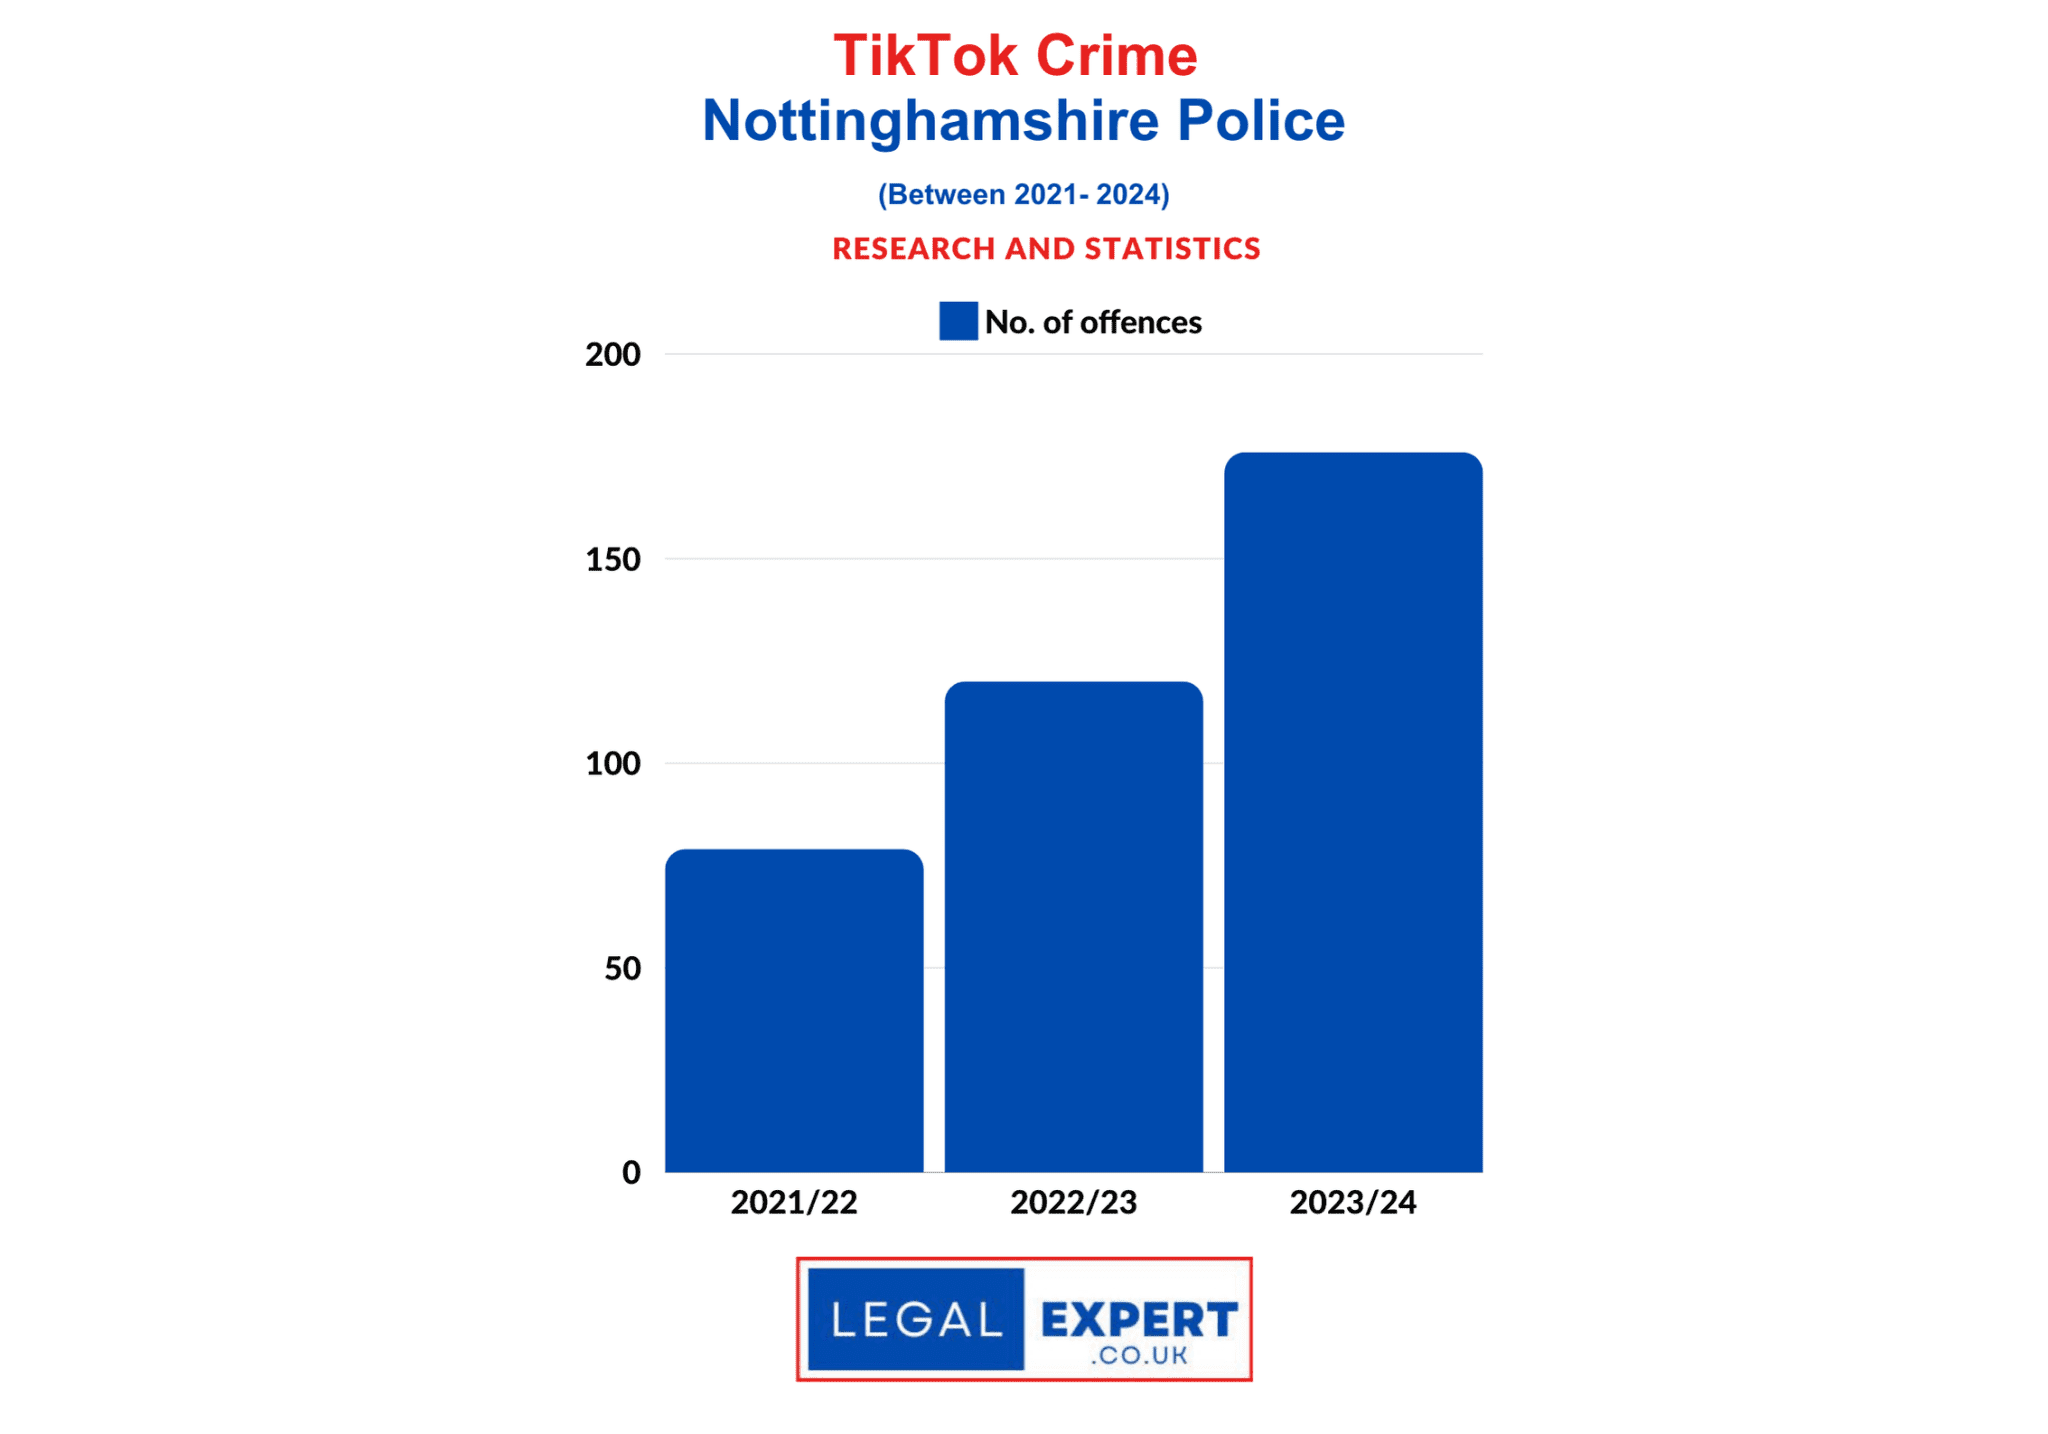
Nottinghamshire Police
20 roads in Nottinghamshire where drivers have been caught speeding (2023/24)
Location | No. of Notes of Intended Prosecution (NIPs) Issued
| Location | NIP’s Issued |
| A38 Kings Mill Rd / Kirkby Rd, Sutton in Ashfield, Notts | 17498 |
| M1, South Bound, Nottinghamshire | 3536 |
| M1, South Bound, Notts. | 3444 |
| A6464 Woodside Road, Beeston, Nottingham | 3183 |
| B679 Clifton Lane, Wilford, Nottingham | 3161 |
| A453, Remembrance Way, Clifton, Nottingham | 2580 |
| A6005, Bye-Pass Road, Chilwell, Nottingham | 2470 |
| A610 Eastwood By-Pass, Kimberley, Nottingham | 2187 |
| A610 Nuthall Road, Nottingham | 1877 |
| M1, North Bound, Notts. | 1856 |
| B6009 Watnall Road, Hucknall, Notts | 1744 |
| A6005, Bye-Pass Road, Chilwell, Nottingham | 1684 |
| A610 Nuthall Road, Nottingham | 1667 |
| M1, North Bound, Notts | 1488 |
| Awsworth Lane, Cossall, Notts | 1400 |
| M1 South Bound, Notts | 1287 |
| A6009 Rosemary St, Mansfield, Notts | 1176 |
| A610 Nuthall Road, Nottingham | 1161 |
| A52, Clifton Boulevard, Nottingham. | 1087 |
| B600 Main Road, Watnall, Notts | 1075 |
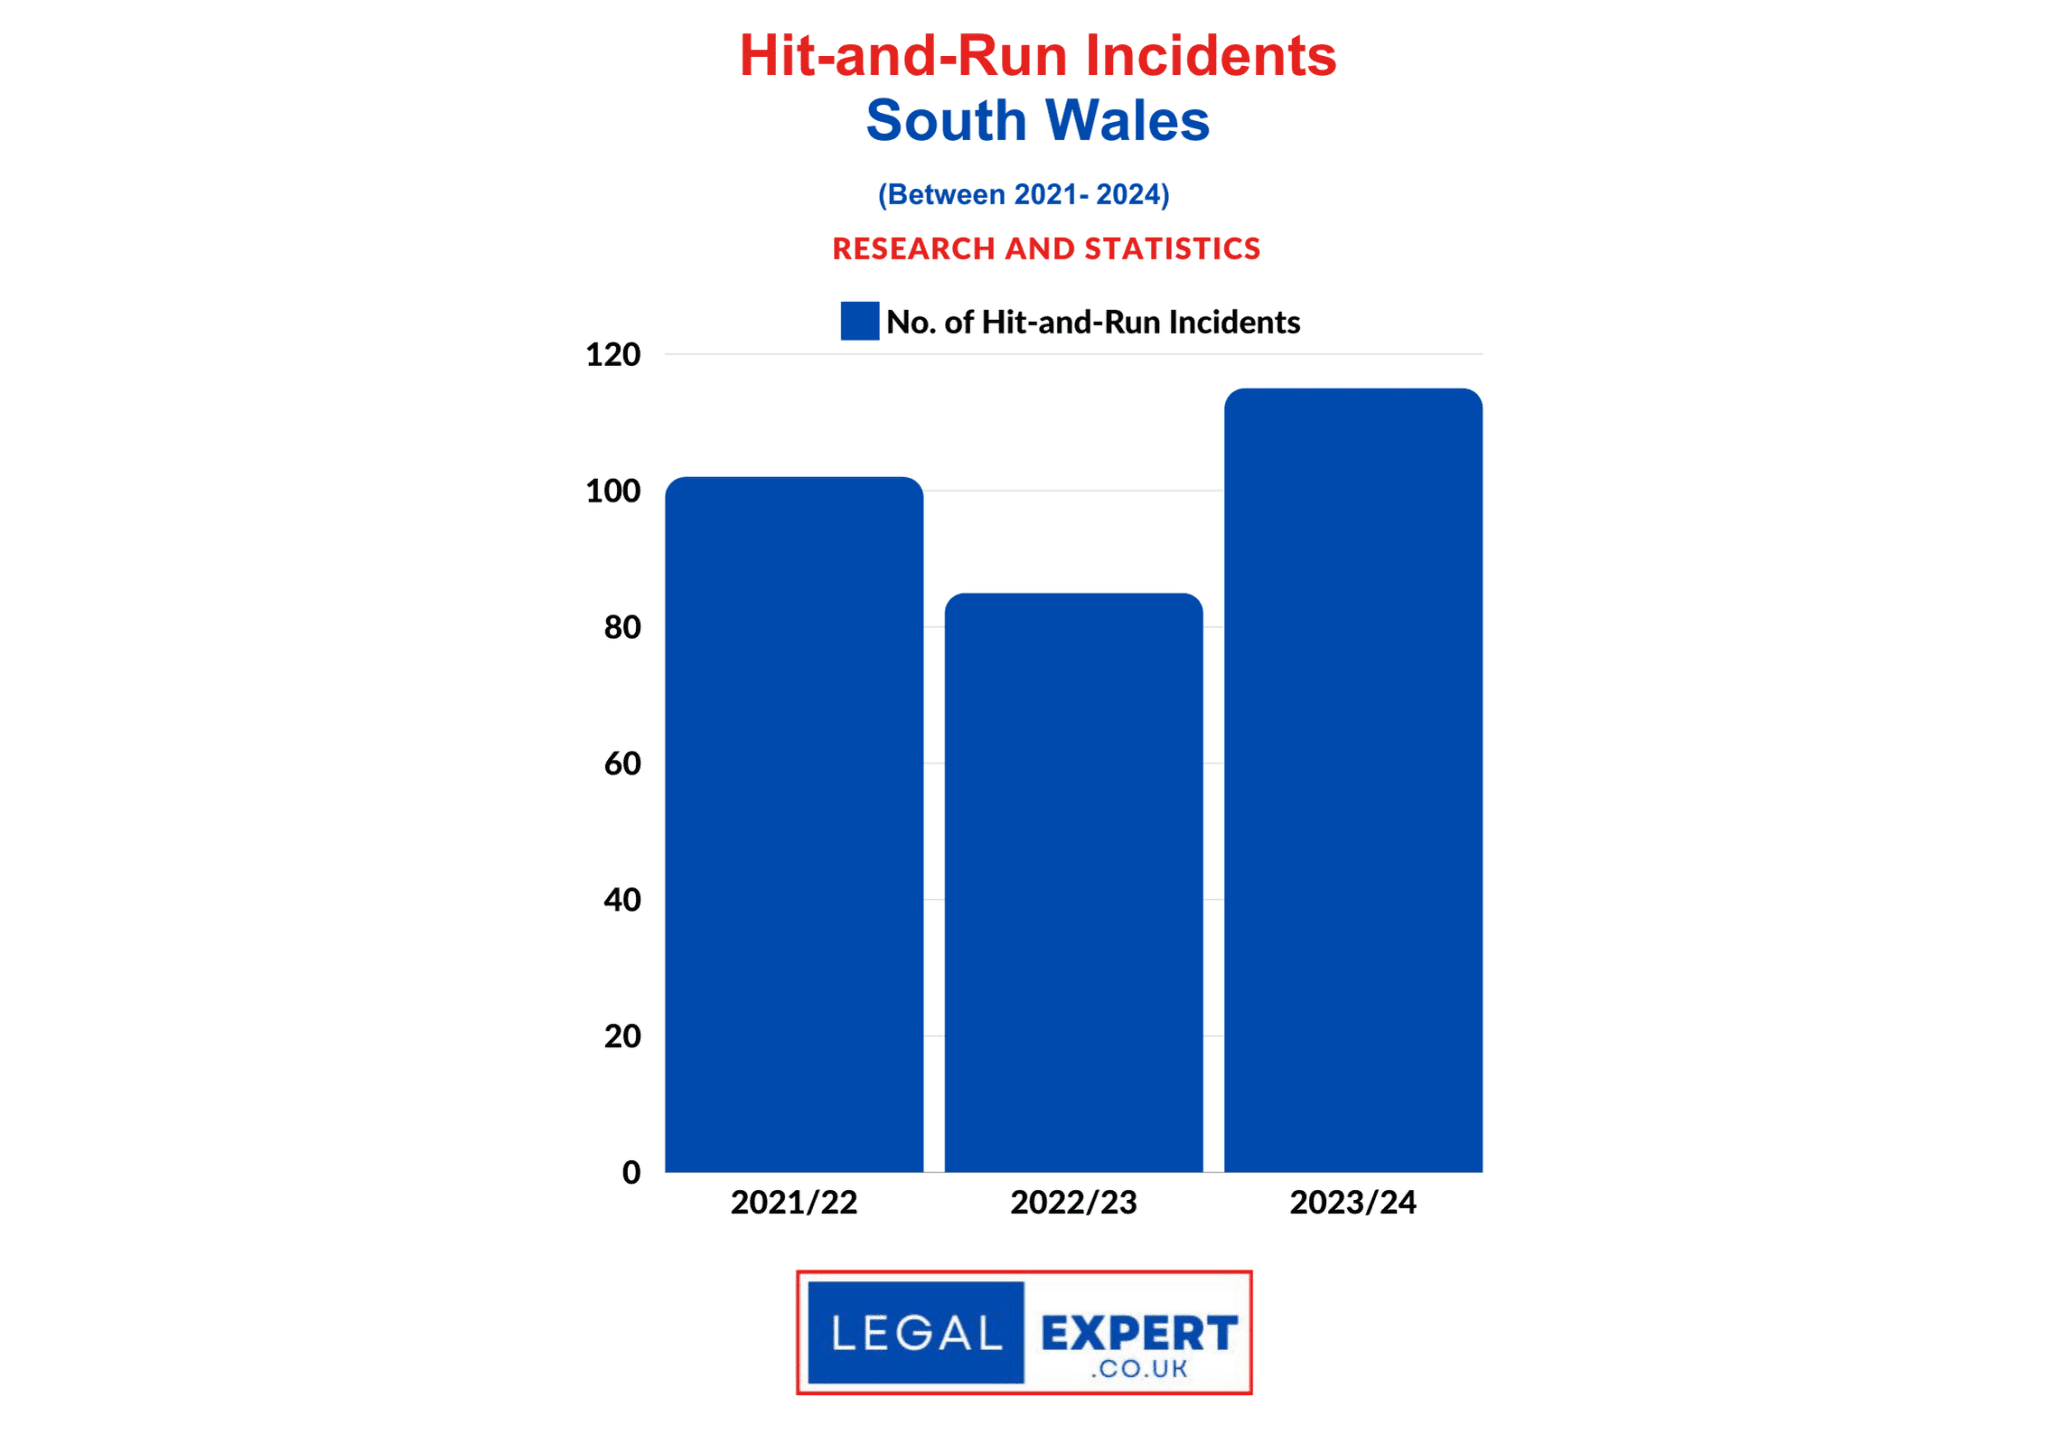
South Wales
No. of speeding fines issued
2021/22 | 76,340
2022/23 | 57,578
2023/24 | 61,390
Total | 195,308
20 roads in South Wales where drivers have been caught speeding (2023/24)
Location | No. of Notes of Intended Prosecution (NIPs) Issued
| Location Address | Amount of Notice of Intended Prosecutions issued |
| A48 Western Avenue Jct with Excelsior Road Cardiff | 8,060 |
| A470 Northern Avenue Cardiff | 6,284 |
| A4241 Afan Way Jct Victoria Road Port Talbot EB | 2,576 |
| Carmarthen Road (Near Cave Street), Swansea | 1,713 |
| North Road, Cardiff (Southbound) | 1,612 |
| Fabian Way Vicinity of Swansea University WB Neath Port Talbot | 1,483 |
| A48 Newport Rd, Nr Cardiff Garden Centre, Cardiff | 1,454 |
| A483 Fabian Way, St Thomas, Swansea | 1,431 |
| M4 Port Talbot EB (Averaged speed detetion zone) o-s 4-5 | 1,615 |
| Fabian Way Jct Elba Crescent EB Neath Port Talbot | 1,166 |
| Mumbles Road, Blackpill, Swansea (Westbound) | 1,140 |
| M4 Overbridge Nr Groesfaen J33-J34 | 1,121 |
| M4 Port Talbot WB (Average speed detection zone) o-s 2-3 | 1,927 |
| Fabian Way Vicinity of Swansea University EB Neath Port Talbot | 968 |
| A4241 Afan Wy Jct Victoria Road Port Talbot WB | 857 |
| Pentwyn Road, Pentwyn, Cardiff | 830 |
| Peniel Green Road, Swansea | 792 |
| A4161 Newport Rd JW Rover Way Cardiff | 784 |
| A4161 Newport Rd JW Colchester Ave Cardiff | 755 |
| Newport Road, Rumney Hill, Cardiff | 738 |
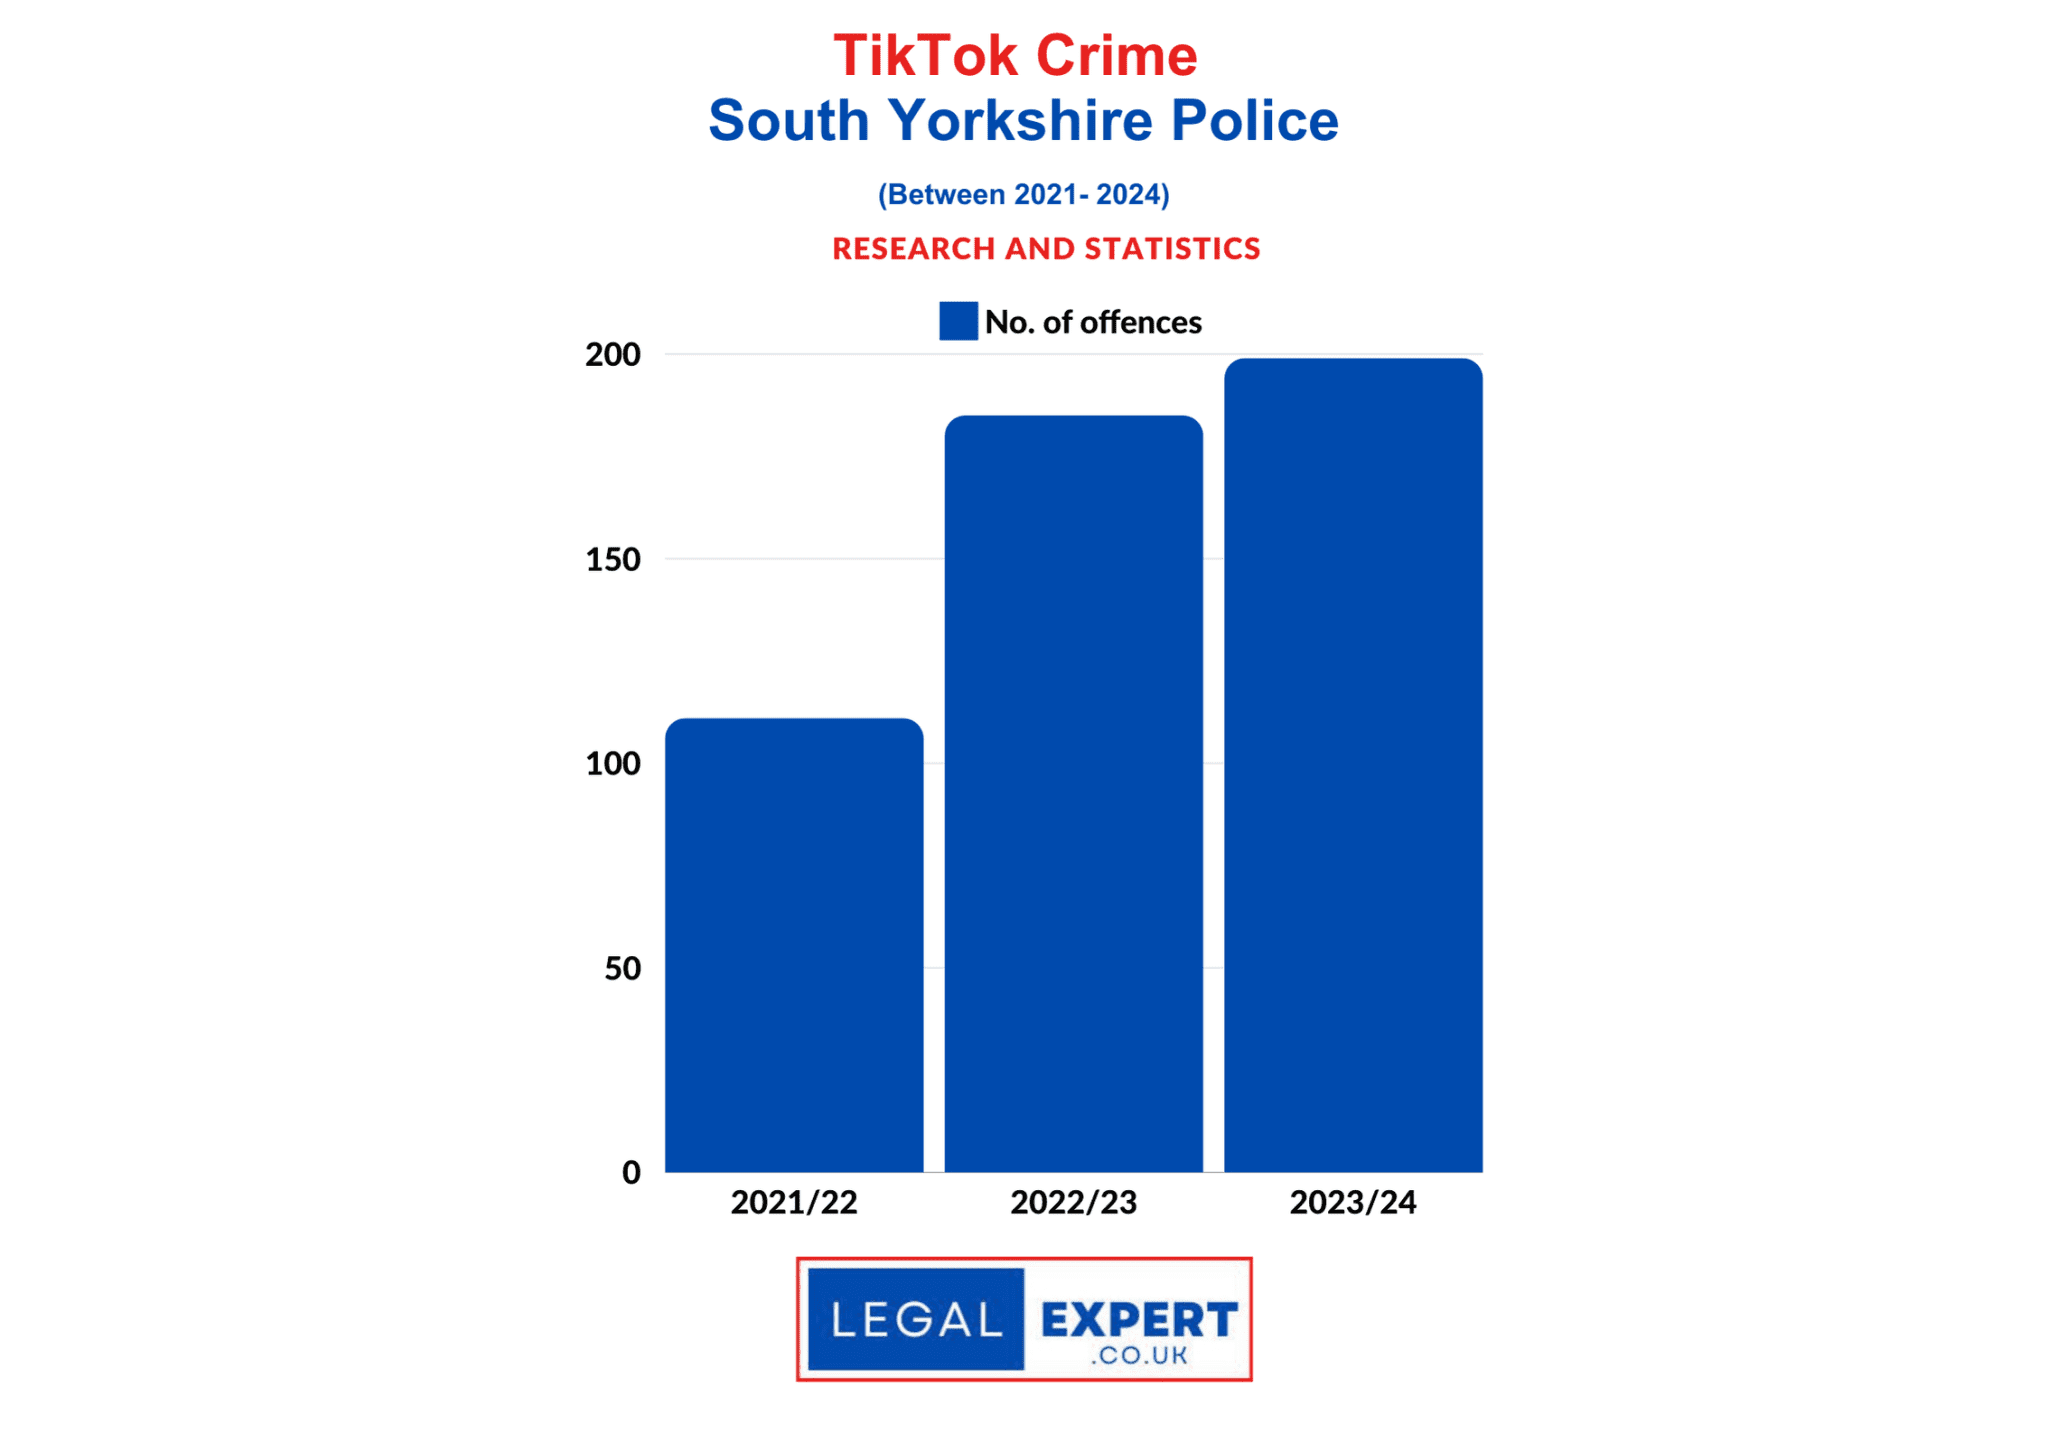
South Yorkshire
No. of speeding fines issued
2021/22 | 73,558
2022/23 | 83,257
2023/24 | 74,508
Total | 231,323
20 roads in South Yorkshire where drivers have been caught speeding (2023/24)
- M1-4491B J32 – J31 Southbound, Exceed a variable speed limit 50mph
- A61 Penistone Road near Rutland Road, Sheffield (S)
- M1-4491B J32 – J31 Southbound, Exceed a variable speed limit 60mph
- M1-4550B J33 – J32 Southbound, Exceed a variable speed limit 60mph
- A633 High Street near Bellows Road, Rawmarsh, Rotherham (S)
- A616(T) East from 400m past A629 exit for 1.6km, Barnsley
- A625 Ecclesall Road South near Ringinglow Road, Sheffield (W)
- A616(T) West from 800m past A61 island for 1.77km, Barnsley
- A616T East from 80m past A6102 exit for 2.2km, Barnsley
- A638 York Road near Pipering Lane West, Doncaster (S)
- A616(T) at Langsett, Barnsley (Eastbound)
- Highgate Lane near West View Crescent, Goldthorpe, Barnsley (S)
- A616(T) at Midhopestones, Barnsley (Westbound)
- A631 East Bawtry Road near Bent Lathes Avenue
- A6135 Birley Moor Road near Thornbridge Drive, Sheffield (N)
- A618 Aughton Road near Westfield Avenue, Aughton, Rotherham (N)
- A629 Halifax Road near Cote Lane, Thurgoland
- M1-4491B J32 – J31 Southbound, Exceed a variable speed limit 40mph
- A630 Warmsworth Road at Waverley Ave, Warmsworth, Doncaster E
- A6135 Burngreave Road near Melrose Rd, Burngreave, Sheffield (S)
Staffordshire Police
2024/25 | 54,375
20 roads in Staffordshire where drivers have been caught speeding (2024/25)
| M6 SOUTHBOUND BETWEEN JUNCTIONS 13-10A (1/2 MILE AFTER JUNCTION 11) | 8880 |
| M6 NORTHBOUND BETWEEN JUNCTIONS 10A-13 (APPROX 2 MILES BEFORE JUNCTION 13) | 3183 |
| M6 SOUTHBOUND BETWEEN JUNCTIONS 15-14 (APPROX 3 1/2 MILES AFTER JUNCTION 15) | 2863 |
| M6 SOUTHBOUND BETWEEN JUNCTIONS 14-13 (APPROX 2 1/2 MILES BEFORE JUNCTION 13) | 2550 |
| M6 NORTHBOUND BETWEEN JUNCTIONS 13-14 (APPROX 2 1/2 MILES AFTER JUNCTION 13) | 2298 |
| A38 STREETHAY N/B BETWEEN MP 412/0A AND MP 413/2A | 2080 |
| A34 NEWCASTLE RD, TRENT VALE | 1466 |
| A500 N/B BETWEEN THE A5006/A52 SHELTON OLD ROAD OVERBRIDGE AND THE A527 | 1270 |
| A500 N/B BETWEEN THE A519 NEWCASTLE ROAD ROUNDABOUT AND THE A50 JUNCTION | 1176 |
| M6 NORTHBOUND BETWEEN JUNCTIONS 14-15 (APPROX 4 1/2 MILES BEFORE JUNCTION 15) | 1120 |
| M6 NORTHBOUND BETWEEN JUNCTIONS 10A-13 (1 MILE BEFORE JUNCTION 12 FOR THE A5 TELFORD) | 927 |
| A38 STREETHAY S/B BETWEEN MP 413/2B AND MP 412/0B | 911 |
| A500 S/B BETWEEN THE A527 JUNCTION TO NORTH OF B5045 SHELTON NEW ROAD OVERBRIDGE | 821 |
| A51 LONDON ROAD, WESTON NEAR STAFFORD | 735 |
| A449 STAFFORD ROAD, COVEN HEATH, SOUTH STAFFORDSHIRE | 685 |
| M6 BETWEEN J14 & J13 (ASTON BANK OVERBRIDGE) | 578 |
| M6 / M6 TOLL AT J11A (GREAT SAREDON ROAD OVERBRIDGE) | 560 |
| A51 LONDON ROAD, WESTON NEAR STAFFORD | 486 |
| A5008 POTTERIES WAY | 466 |
| A50 NEAR UTTOXETER, BURTON UPON TRENT | 462 |
Suffolk Constabulary
No. of speeding fines issued
2021/22 | 41,174
2022/23 | 35,659
2023/24 | 46,077
Total | 122,910
20 roads in Suffolk where drivers have been caught speeding (2023/24)
Location | No. of Speeding Offences
| Road Name | Number of Offences |
| A14 | 12652 |
| A12 | 4390 |
| A11 | 2874 |
| A140 | 2047 |
| A143 | 1550 |
| B1122 | 876 |
| B1112 | 774 |
| A1214 | 774 |
| A1120 | 759 |
| A134 | 688 |
| B1115 | 652 |
| A1101 | 643 |
| A131 | 627 |
| A144 | 588 |
| B1077 | 584 |
| A137 | 550 |
| B1117 | 498 |
| B1113 | 490 |
| A145 | 426 |
| B1061 | 422 |
Surrey Police
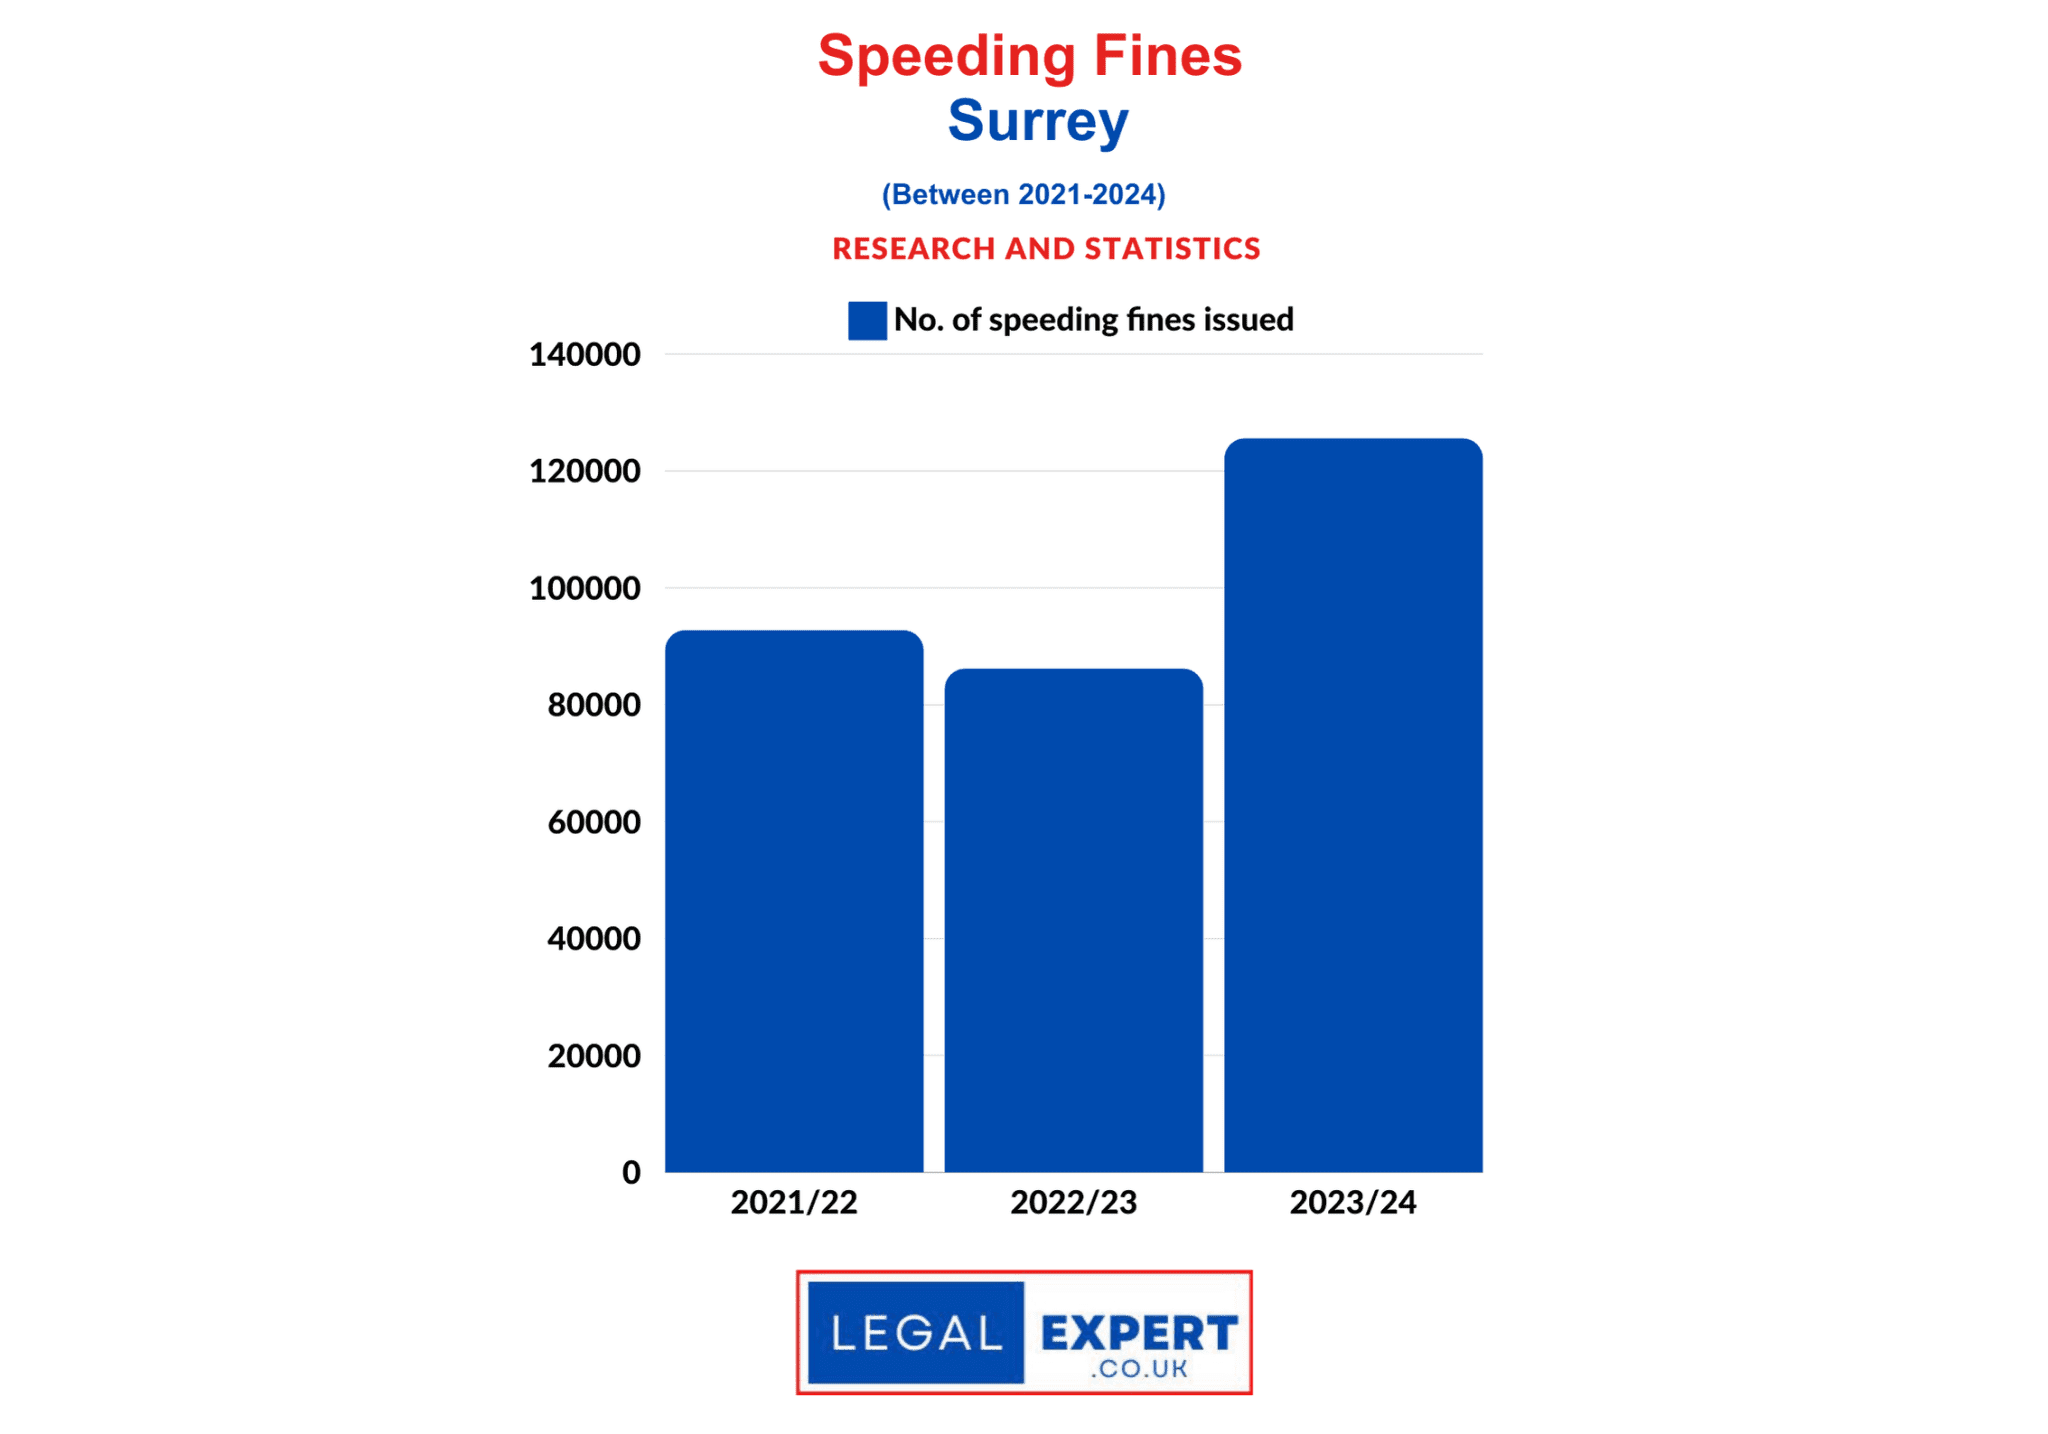
Speeding Offences Surrey
No. of speeding fines issued
2021/22 | 92,788
2022/23 | 86,215
2023/24 | 125,588
Total | 122,910
20 roads in Surrey where drivers have been caught speeding (2023/24)
Location | No. of Speeding Offences
- M25 J7-16 scheme | 21,989 offences
- A217 Dover’s Green Road Reigate | 18,129 offences
- M3 J2-4a scheme | 14,526 offences
- M25/M3 Junction average speed scheme | 13,592 offences
- M23 J8-10 scheme | 10,522 offences
- A320 Victoria Way Woking | 4,356 offences
- St Peter’s Way Chertsey | 3,887 offences
- A309 Hinchley Wood | 3,021 offences
- A25 Epsom Road Merrow | 2,911 offences
- A3 Guildford & Godalming Bypass | 2,381 offences
- A217 Lower Kingswood to Banstead average speed scheme | 2,093 offences
- A318 New Haw Road Addlestone | 2,016 offences
- Cheam Road Ewell | 1,808 offences
- A240 Burgh Heath | 1,692 offences
- A3 Esher Bypass Hook | 1,632 offences
- Christ Church Road Epsom | 1,357 offences
- A22 Godstone Road Whyteleafe | 1,338 offences
- A24 Ewell Bypass | 1,310 offences
- Charlton Road Charlton | 1,151 offences
- A23 Merstham | 1,149 offences
Sussex Police
No. of speeding fines issued
2021/22 | 78,938
2022/23 | 73,244
2023/24 | 61,867
Total | 214,049
West Midlands Police
No. of speeding fines issued
2021/22 | 95811
2022/23 | 87505
2023/24 | 87708
Total | 271024
Top roads in Birmingham where drivers have been caught speeding (2023/24)
Birmingham
| Location | Total Offences | |
| 1 | A38 Bristol road between Speedwell Road and Priory road | 1655 |
| 2 | B4121 Shenley lane near to Meadowbrook road | 1421 |
| 3 | A38 Bristol road between priory road and speedwell road | 1129 |
| 4 | A4040 Sandwell road between Oxhill road and Island Road, Handsworth | 1079 |
| 5 | A456 Hagley road between Portland Road and Lordswood Road | 981 |
| 6 | A4540 New John Street West between Lucas Circus and Hospital Street, Birmingham | 910 |
| 7 | A4540 New John Street West between Hospital Street and Lucas Circus | 801 |
| 8 | A4040 Marsh Hill (east bound) between Gipsy Lane and Streetly Road, Birmingham | 742 |
| 9 | Leebank Middleway / Belgrave Middleway towards Haden Circus roundabout | 685 |
| 10 | A452 Chester road opposite Little Pitts Close Erdington | 669 |
| 11 | A4040 Stockfield Road between Yardley Road and Warwick Road | 657 |
| 12 | A45 Coventry Road between Berkley Road and Rowland Road/Steyning Road | 627 |
| 13 | A38 Bristol Road South near South Road (out of city) | 596 |
| 14 | B4114 Washwood Heath Road between Bromford Lane and Highfield Rd | 567 |
| 15 | A45 Small Heath Highway approaching one-way system (into city), Birmingham | 565 |
| 16 | Heartlands Parkway between Star City and Bromford Lane | 557 |
| 17 | A452 Chester Road approaching Pype Hayes Road Erdington | 550 |
| 18 | Ridgacre Road, between Ridgacre Lane and Worlds End Lane, Quinton | 522 |
| 19 | A34 Stratford Road between Wycome Road and Robin Hood island | 516 |
| 20 | B4120 Lickey Road, Rednal, between A38 Bristol Rd South and Lowhill Lane toward Barnt Green | 513 |
Coventry
| CV | Location | Camera type | Total offences |
| 1 | A4114 London Road (southbound) near railway bridge | Average | 981 |
| 2 | A4114 London Road (northbound) near railway bridge | Average | 888 |
| 3 | Foleshill Road between eagle street and ringway St Nicholas | Average | 751 |
| 4 | B4110 London road between Allard Way and Robert Close | Average | 557 |
| 5 | Foleshill Road between ringway St Nicholas and Eagle Street north bound | Average | 356 |
| 6 | Hinckley Road between Woodway Lane and Wigston Road | Average | 260 |
| 7 | Walsgrave Road between Briton Road and Church Lane | Average | 199 |
| 8 | B4076 Counden Wedge Drive south towards A4114 Pickford way Coventry | Mobile | 187 |
| 9 | B4109 Aldermans Green Road (north bound) between Eburne Road | Mobile | 174 |
| 10 | Hinckley Road between Wigston Road and Woodway Lane | Average | 139 |
| 11 | B4110 London Road between Robert Close and Allard Way | Average | 119 |
| 12 | Walsgrave Road between Church Lane and Briton Road | Average | 116 |
| 13 | Bell Green Road between Sewall Highway and Old Church Road | Average | 79 |
| 14 | Binley Road (opposite Stoke Green) towards Walsgrave | Average | 77 |
| 15 | Binley Road between Bray Lane and Sky Blue Way | Average | 68 |
| 16 | B4109 Aldermans Green Road (south bound) between Lentons Lane | Mobile | 54 |
| 17 | B4076 Counden Wedge Drive north towards Jaguar entrance island, Coventry | Mobile | 50 |
| 18 | Bell Green Road between Old Church Road and Sewall Highway | Average | 39 |
| 19 | The Scotchill / Burnaby road between Beake Avenue and Keresley Road | Average | 36 |
| 20 | A4600 Ansty road (west bound) between Clifford Bridge Road & Sewell Highway | Average | 33 |
Dudley
| DY | Location | Camera type | Total offences |
| 1 | A4123 (south bound) between Tipton Road and Burnt Tree Island, Dudley | Average | 880 |
| 2 | A4036 Thorns Road between Thornhill Road and Caledonia towards Lye | Mobile | 416 |
| 3 | A4123 (north bound) between Burnt Tree island and Tipton Road | Average | 402 |
| 4 | A461 Dudley southern bypass (Duncan Edwards Way) towards Cinder Bank Island | Mobile | 278 |
| 5 | A4036 Thorns Road between Caledonia and Thornhill Road towards Brierley Hill | Mobile | 227 |
| 6 | A449 Kidderminster road between Foundry Road and B4178 Swindon Road Wall Heath Dudley | Mobile | 207 |
| 7 | A456 Manor Way (Halesowen bypass) towards Grange Road island | Mobile | 205 |
| 8 | A458 Windmill Hill towards Lye | Average | 199 |
| 9 | A458 Windmill Hill towards Halesowen | Average | 134 |
| 10 | Sandyfields Road between Oakleigh drive and Chaucer Avenue (west bound) | Mobile | 100 |
| 11 | A456 manor way (Halesowen bypass) between Grange Road island and Sandvik engineering | Mobile | 80 |
| 12 | B4043 Manor lane towards Kent Road Halesowen | Mobile | 79 |
| 13 | A449 Kidderminster Road between B4178 Swindon Road and Foundry Road Wall Heath Dudley | Mobile | 72 |
| 14 | Saltwells Road (zone 1) between Weavers Rise and Crabourne Road, Brierley Hill | Mobile | 68 |
| 15 | Saltwells Road between Crabourne Road and Cradley Road | Mobile | 55 |
| 16 | Sandyfields Road between Chaucer Avenue and Oakleigh Drive (east bound) | Mobile | 51 |
| 17 | Milking Bank towards Dibdale Road, Lower Gornal | Mobile | 51 |
| 18 | Milking Bank towards Himley Rd, Lower Gornal | Mobile | 50 |
| 19 | A457 Tipton Road between Gate Street and Park Road | Mobile | 42 |
| 20 | A457 Tipton Road between Park Road and Gate Street towards Sedgley | Mobile | 40 |
Sandwell
| SW | Location | Camera type | Total offences |
| 1 | M6 (north bound – atm) between junctions 7 & 8(north bound) | Variable | 13286 |
| 2 | A34 Birmingham Road between Wilderness Lane and Lodge Road (northbound) | Average | 2013 |
| 3 | A41 Black Country New Road between Patent Shaft roundabout and Moxley junction (northbound) | Average | 1263 |
| 4 | A34 Birmingham Road opposite Pages Lane towards Birmingham | Mobile | 769 |
| 5 | A41 Black Country New Road at Swan Island to Birmingham | Mobile | 324 |
| 6 | A4041 Newton Road at Pear Tree Drive towards West Bromwich | Mobile | 251 |
| 7 | A41 Black Country New Road at George Henry Road | Mobile | 233 |
| 8 | A41 Black Country New Road at Pacific Avenue to Wolverhampton | Mobile | 202 |
| 9 | A4123 Wolverhampton Road between Pound Road and Bleakhouse Road (southbound) | Average | 173 |
| 10 | A4123 Wolverhampton Road between Bleakhouse Road and Pound Road (northbound) | Average | 159 |
| 11 | A41 Black Country New Road at Swan island to Wolverhampton | Mobile | 140 |
| 12 | A459 Halesowen Road towards Old Hill | Mobile | 136 |
| 13 | A4031 Trinity Way between Expressway and Kenrick Way | Mobile | 133 |
| 14 | A41 Birmingham Road towards Birmingham | Mobile | 106 |
| 15 | Greets Green Road between Brandon Way and Oldbury Rd | Mobile | 97 |
| 16 | Leabrook Road towards Tipton | Mobile | 97 |
| 17 | Woden Road south, between Bridge Street and Hydes Road | Mobile | 78 |
| 18 | Oakham Road between Turners Hill and Dundas Avenue | Mobile | 76 |
| 19 | A462 Darlaston Road, Kings Hill north towards A4038 Walsall Road | Mobile | 61 |
| 20 | A41 Black Country New Road at Steel island to Birmingham | Mobile | 59 |
Solihull
| SH | Location | Camera type | Total offences |
| 1 | M6 between junctions 4 & 5 north bound | Average | 1014 |
| 2 | A452 collector Road(east) between Parkfield Drive & near Lanchester way | Mobile | 739 |
| 3 | M6 between junctions 5 & 4 south bound | Average | 642 |
| 4 | A34 Stratford Road between Dog Kennel Lane and B4102 Marshall Lake Road west bound | Average | 617 |
| 5 | A452 Collector Road (east) between Lanchester Way & Birmingham Road | Mobile | 309 |
| 6 | M42 (north bound – atm) between junctions 3a & 4(north bound) | Variable | 296 |
| 7 | M6 (north bound – atm) between junctions 4 & 5(north bound) | Variable | 264 |
| 8 | Damson parkway from Coventry road towards Solihull Moors | Mobile | 256 |
| 9 | A3400 Stratford Road between School Road and Avenue Albert | Average | 232 |
| 10 | A34 Stratford Road between Dog Kennel Lane and M42 junction 4 east bound | Average | 229 |
| 11 | B425 Lode Lane between Moat Lane and Henley Crescent, Solihull | Average | 226 |
| 12 | Damson Parkway from Solihull moors FC towards Coventry Road | Mobile | 224 |
| 13 | A34 Stratford Road, Hall Green, between Collister Close & Solihull Lane toward Hall Green | Mobile | 211 |
| 14 | B4114 Bradford Road between Old Croft Lane and Chester Road, Solihull | Average | 196 |
| 15 | B4114 Bradford Road between Chester Road and Old Croft Lane, Solihull – 30mph | Average | 195 |
| 16 | A34 Stratford Road between B4102 Marshall Lake Road and Dog Kennel Lane east bound | Average | 189 |
| 17 | A41 Warwick Road between Ashleigh Road and railway bridge | Mobile | 181 |
| 18 | A4141 Warwick Road between Hill Farm Gate entrance and Thistlewood Grove towards Warwick | Mobile | 176 |
| 19 | M6 (south bound – atm) between junctions 5 and 4 (southbound) | Variable | 173 |
| 20 | M42 motorway between junctions 4&5 | Average | 158 |
Walsall
| WS | Location | Camera type | Total offences |
| 1 | M6 (south bound – atm) between M54 exit slip & junction 10 – south bound | Variable | 7605 |
| 2 | A4148 Broadway between Persehouse sSreet and Princess Avenue, Walsall | Average | 2994 |
| 3 | A4444 Black Country New Road between Moxley junction and the Lunt junction (northbound) | Average | 1814 |
| 4 | A34 Birmingham Road between Beacon Road and Chapel Lane (southbound) | Average | 1673 |
| 5 | A34 Birmingham Road between Lake Avenue and Charlemont Road | Average | 637 |
| 6 | A41 Black Country New Road between Moxley junction and Patent Shaft roundabout (southbound) | Average | 635 |
| 7 | A4148 Broadway between Princess avenue and Pershouse Street, Walsall | Average | 566 |
| 8 | A34 Birmingham Road between Charlemont Road and Lake Avenue | Average | 522 |
| 9 | Erdington Road, between Little Aston Road and Cematorium roundabout. | Mobile | 520 |
| 10 | Bentley Lane between Bloxwich Lane and Harvester Road – 30mph | Mobile | 361 |
| 11 | Bentley Lane between Harvester Road to Bloxwich lane – 30mph | Mobile | 358 |
| 12 | Aldridge Road between Bridle Lane and A4041 Queslett road | Mobile | 325 |
| 13 | Aldridge Road between A4041 Queslett road and Bridle Lane | Mobile | 288 |
| 14 | A454 Aldridge Road between Mellish Road and Walsall r
Road |
Mobile | 272 |
| 15 | A4041 Queslett Road, towards the Queslett public house, towards Streetly | Mobile | 264 |
| 16 | Erdington Road, between crematorium roundabout and Little Aston Road | Mobile | 216 |
| 17 | The Parade, Brownhills between A5 Watling Street and A452 Chester road – 30mph | Mobile | 136 |
| 18 | B4152 Northgate between Sunnyside and A454 Little Aston Rd, Aldridge | Mobile | 124 |
| 19 | Reedswood Way between Reedswood Park Road and Bloxwich Lane – 30mph | Mobile | 100 |
| 20 | A4098 Great Bridge Road between metro overbridge & A41 Oxford Street, Bilston | Mobile | 99 |
Wolverhampton
| Wv | Location | Camera type | Total offences |
| 1 | A4444 Black Country New Road between the Lunt junction and Moxley junction (southbound) | Average | 3765 |
| 2 | A449 Stafford Rod approaching Greenwood Road towards Stafford | Average | 1741 |
| 3 | A449 Stafford Road approaching Oxley Avenue towards Wolverhampton | Average | 343 |
| 4 | The Droveway (east bound) between Barnhurst Lane and Blaydon Road | Mobile | 215 |
| 5 | B4161 Henwood Road, north towards Tettenhall Road | Mobile | 214 |
| 6 | A41 Tettenhall Road between Lower Street and Albert Road | Mobile | 144 |
| 7 | Stow Heath Lane between Willenhall Road and Bilston Road, Wolverhampton | Mobile | 87 |
| 8 | A41 Tettenhall road between Paget road and Henwood road | Mobile | 77 |
| 9 | Stow Heath Lane between Bilston Road and Willenhall Road, Wolverhampton | Mobile | 76 |
| 10 | The Droveway (west bound) between Blaydon road & Barnhurst lane | Mobile | 70 |
| 11 | B4484 Willenhall Road Bilston, towards Bunkers Hill Lane | Mobile | 68 |
| 12 | B4161 Henwood Road, south towards Compton Road | Mobile | 67 |
| 13 | Linthouse Lane opposite Springhill Road towards Ashmore Park | Mobile | 55 |
| 14 | A4123 Birmingham New Road approaching Hessian Close towards Birmingham | Mobile | 47 |
| 15 | A454 Willenhall Road approaching Deans Road towards Willenhall | Mobile | 41 |
| 16 | Northycote Lane between Legs Lane and Cat & Kittens Lane | Mobile | 41 |
| 17 | Northycote Lane between Cat & Kittens lane and Legs Lane | Mobile | 35 |
| 18 | B4484 Willenhall Road Bilston, towards Moseley Road | Mobile | 34 |
| 19 | Kitchen Lane between Phillips Avenue and Lint House Lane, Wednesfield | Mobile | 29 |
| 20 | A4123 Birmingham New Road near The Grove approaching Parkfield Road towards Wolverhampton | Mobile | 24 |
West Yorkshire Police
No. of speeding fines issued
2021/22 | 205,970
2022/23 | 191,325
2023/24 | 228,139
Total | 625,434
Wiltshire Police
No. of speeding fines issued
2021/22 | 1,469
2022/23 | 4,096
2023/24 | 9,964
Total | 15,529
Here are the 20 roads in Wiltshire where drivers have been caught speeding in the last year 2023/24 | No. of fines issued
- Swindon – Thamesdown Drive Swindon | 704
- Wilton – The Avenue Wiltshire | 696
- Coombe Bissett – Deegan House Wiltshire | 604
- Harnham – Lime Kiln Way Wiltshire | 389
- Tilshead – Candown Road Wiltshire | 385
- Ludgershall – Tidworth Road Wiltshire | 331
- Wroughton – Swindon Road Swindon | 316
- Avebury Sports and Social Club Wiltshire | 309
- Sutton Benger – B4069 Wiltshire | 283
- Harnham – Portland Avenue Wiltshire | 260
- Westwood – New Inn Wiltshire | 253
- Enford – Old Vicarage Wiltshire | 232
- Shaw and Whitley – A365 Folly Lane Wiltshire | 228
- Ogbourne St Andrew Wiltshire | 227
- Cricklade – Spital Lane Swindon | 165
- Swindon – Queens Drive Swindon | 149
- Cholderton – Church Lane Wiltshire | 146
- Highworth – A361 Swindon Road Swindon | 142
- Swindon Queens Drive (A4259) Swindon | 129
- Tidworth – Police Station Wiltshire | 120